Download presentation
Presentation is loading. Please wait.

1
9/30 Geo Engage Define: –Demography –Doubling Time Explain: – BR-DR= Natural Increase – difference between birth rate and fertility rate Form argument- choose #1 or #2 and explain why you chose it –The earth will not be able to sustain the 9 billion people in 2050 –The earth will be able to sustain the 9 billion people in 2050

2
Population Issues https://www.youtube.com/watc h?v=CAUVGYz3pZwhttps://www.youtube.com/watc h?v=CAUVGYz3pZw Write 4 Facts from the video

3
Elements of Geography So far: –Landforms & Boundaries –Culture –Population What’s next?

4
Elements of Geography So far: –Landforms & Boundaries –Culture –Population What’s next? –Economy –Government

5
Important Reminders Turn in: –5 images (Revolutions)- instagram, memes, or comic strip –Population Pyramids –Econ chart due FRIDAY –TEST NEXT THURSDAY
- instagram, memes, or comic strip –Population Pyramids –Econ chart due FRIDAY –TEST NEXT THURSDAY")
6
World Population Ch. 4 Sec. 2

7
Demography The study of population -#’s -Ethnicities -Common characteristics -Distribution/ Density

8
The study of human populations, including their size, growth, density, distribution, and rates of births, marriages, and deaths. Demography

9
According to the United Nations, the World reached 6 billion people on October 12, 1999.

10
According to the United Nations, the World reached 7 billion people on October 31, 2011.

11
Population Growth 1000-1800: 1 billion ppl 1800-1950: 2 billion ppl –Doubled in 150 yrs 1950-2000: 6 billion ppl –Tripled in 50 years By 2050: 9 billion ppl!!

13
Between 1800 and 1950, the world population doubled, reaching 1 billion. We reached 6 billion in 1999. At its current rate, we will pass 9 billion by the year 2050. 7 Billion Vid

14
Frank and Ernest on Population

15
Frank and Earnest on Population Explosion

16
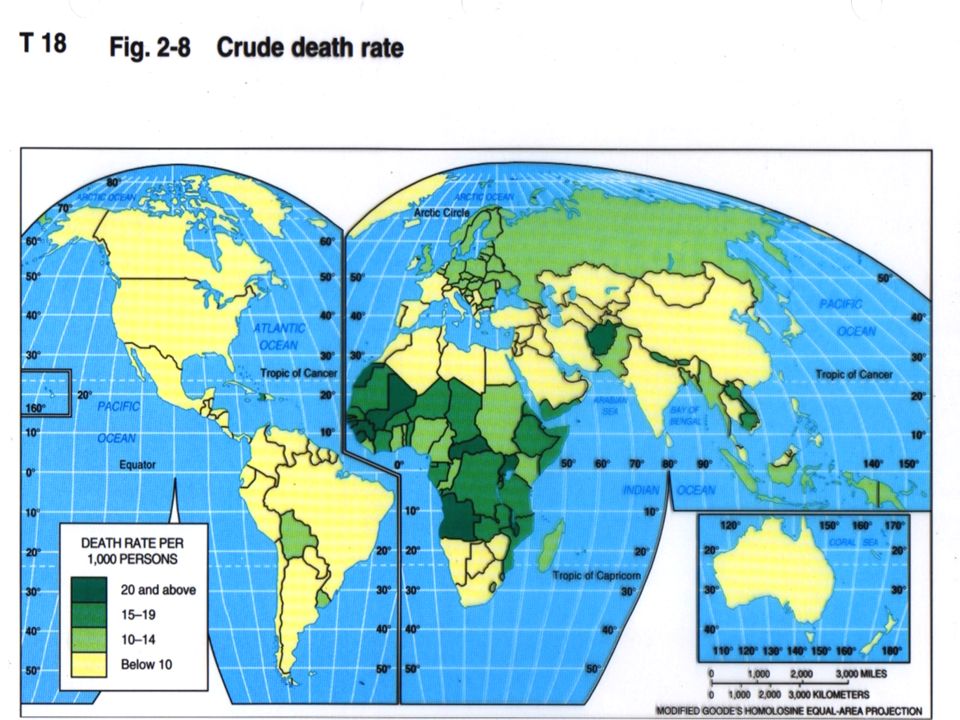
Growth Rates Death rate: # of ppl that die every year per 1,000 Birth rate: # of ppl born every year per 1,000 Natural Increase (growth rate)= BR – DR
= BR – DR")
19
Rates of Natural Increase

20
Frank and Earnest on Birthrate

21
Growth Rates Life expectancy- average number of years ppl live w/ in a given population Fertility rate- (avg. amount of children/family) Infant mortality rate- # of deaths of infants under 1 yr. per 1,000 live births Child mortality rate- # of deaths of children ages 1-5 per 1,000
 Infant mortality rate- # of deaths of infants under 1 yr. per 1,000 live births Child mortality rate- # of deaths of children ages 1-5 per 1,000.")
22
Fertility Rates 2.1 is generally regarded as a replacement rate (the rate at which a population neither grows nor shrinks) in the developed world. In less developed countries this rate should be higher (2.8?). Iran4.7Mexico2.57 USA2.0Haiti4.3 Italy 1.2India3.0 Russia 1.3China1.82 Why do women choose to have so many children in some countries and not it others?
. Iran4.7Mexico2.57 USA2.0Haiti4.3 Italy 1.2India3.0 Russia 1.3China1.82 Why do women choose to have so many children in some countries and not it others .")
23
Fertility Rates 2.1 is generally regarded as a replacement rate (the rate at which a population neither grows nor shrinks) in the developed world. In less developed countries this rate should be higher (2.8?). Iran4.7Mexico2.57 USA2.0Haiti4.3 Italy 1.2India3.0 Russia 1.3China1.82 Why do women choose to have so many children in some countries and not it others? High infant mortality No Social Security Cultural preferences and fashion
. Iran4.7Mexico2.57 USA2.0Haiti4.3 Italy 1.2India3.0 Russia 1.3China1.82 Why do women choose to have so many children in some countries and not it others. High infant mortality No Social Security Cultural preferences and fashion.")
24
Infant Mortality

25
Doubling time: –# of yrs. it takes a pop. to double in size –Parts of Asia, Africa, Latin Am. = 25 yrs. –Wealthy countries = 300 yrs.

26
Growth Rates How would death rates ? –Better health care/ meds. –More food –Better technology –Better living conditions, sanitation (think after Industrial Revolution)
.")
27
Growth Rates Zero Population growth occurs when BR = DR –Usually happens only in wealthy countries –Most rural areas have tradition of many kids (farm work)
")
28
90% of earth's population growth occurs in developing countries.

29
In Bangladesh- most densely populated country in world

30
Population Problems What would be problems of rapid growth? –Enough food to feed all –Resource shortages (water, housing, clothing) –Age distribution (too young)
 –Age distribution (too young).")
32
Nairobi, Kenya Mumbai, India

41
http://populationpyramid.net/

42
Population Positives What are good things that come with growth? –Levels of technology/creativity rises Adv. in agriculture help food prod. –Enough workers to keep economy going

43
Negative Pop. Growth Occurs when DR > BR –Not enough workers –Labor must be brought in problems b/w different cultures

44
Population Distribution Pop. Dist. = pattern of human settlement Due to inhospitable land, ppl only live on 1/3 of Earth’s land Ecumene= portion of earth occupied by permanent human settlement Need 3 things: –Available water, fertile soil, & a good climate

45
Which continents are the most densely populated? What regions tend to be the least populated- think climate? Which is more populated- urban areas or rural areas?

46
Population Density Pop. Dens.= ppl per sq. mile –Total population / total land area (arithmetic pop. dens.) Some countries have wide open areas= low pop. dens. Some are tinier countries= high pop. dens. –Ex: Belgium & Niger
 Some countries have wide open areas= low pop. dens. Some are tinier countries= high pop. dens. –Ex: Belgium & Niger.")
48
Population Density Uneven distribution- not all land is usable –Egypt: 99% of pop. lives w/in 20 miles of Nile the rest is desert –Use physiological pop. dens. = Total population / total arable land –181 ppl/sq. mile vs. 5,807 ppl/sq. mile

49
Population Movement Migration: ppl move place to place –City to city, suburb to suburb, rural to urban

50
Urbanization What are reasons to move to the city? –Jobs –Education –Land goes bad –Health care/ social services ½ of world’s population lives in cities!

51
Migration Between countries: –Emigrants in home country –Immigrants in new country Reasons to leave: –War, food shortages, jobs, education, oppression/ persecution, disaster

Similar presentations


 Diffusion – spread of one culture.>")


>")
