Download presentation
Presentation is loading. Please wait.

1
Figure 1: Deaths per 1,000 prisoners by apparent cause, 12 months ending December 2000 to 12 months ending June 2016, England and Wales

5
Age at death by cause 2014-5

7
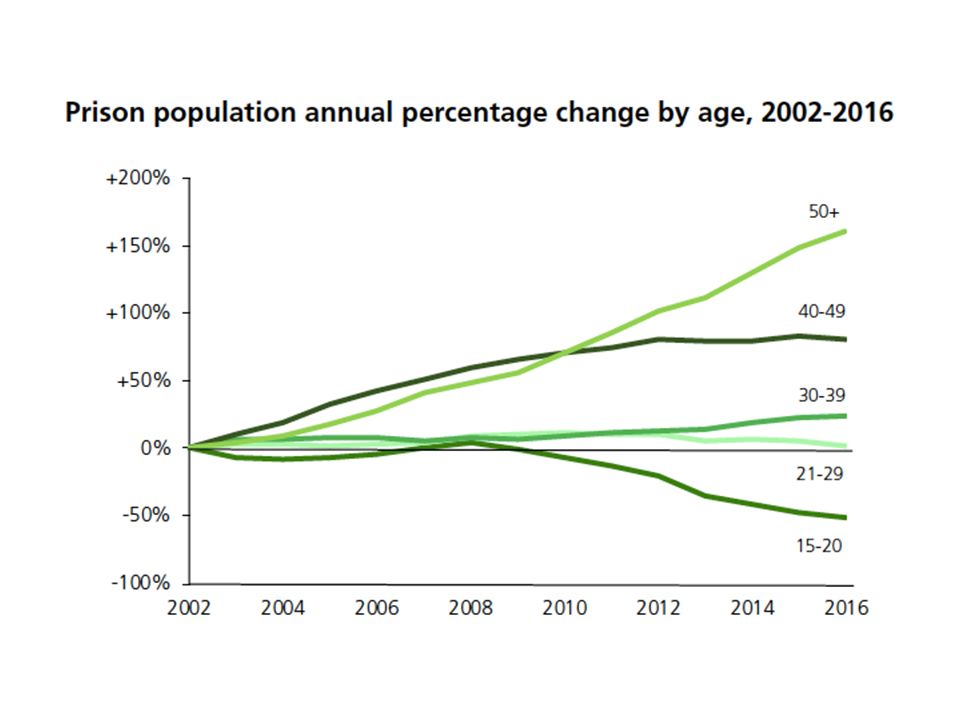
Conclusions PPO reports raise the health issues but it is the courts that determine the size and structure of the prison population Health, local authorities, probation, police courts working together can….. –Identify population at risk –Deliver integrated, innovative, effective services reducing avoidable mortality –Increase courts’confidence in community alternatives to custody

8
Annual Standardised Mortality Ratio (SMR) for prison population, 2005 to 2014, England and Wales
 for prison population, 2005 to 2014, England and Wales")
9
Inequalities in life expectancy in Britain Nationally there have been rapid increases in inequality since 2002 by area Difference between best and worst-off districts by life expectancy (years)
")
10
0 5 10 15 20 25 30 35 40 45 250 200 150 100 50 0 % Poverty SMR <65 Poverty, deprivation and health: the dose-response has been known for many years Source: Modified graph from Shaw, Dorling, Gordon & Smith (1999): The widening gap. Health inequalities and policy in Britain. The Policy Press. Bristol. Scatterplot of standardized mortality ratio for deaths under 65 and % of households living in poverty (Breadline Britain index), for parliamentary constituencies (Britain (1991-1995)
, for parliamentary constituencies (Britain ( ).")
11
Polarisation even for the rarest causes Poverty and Murder in Britain Source: Data from Dorling, Gordon, Hillyard, Pantazis, Pemberton, &Tombs (2008): Criminal obsessions: why harm matters more than crime. Second Edition. London: Centre for Crime and Justice Studies. http://www.crimeandjustice.org.uk/

Similar presentations


 Strategic Assessment Alan Howard Planning & Compliance Officer SWSCJA.>")


