Download presentation
Presentation is loading. Please wait.

1
Feeding the Obese Critically Ill
Daren K. Heyland Professor of Medicine Queen’s University, Kingston General Hospital Kingston, ON Canada

2
Objective

3
Key Points Not all obese patients are the same
Nutritional approach may need to vary Challenge to the prevailing dogma that hypocaloric feeding (undernourishment) is acceptable
 is acceptable.")
4
Obesity Trends* Among U.S. Adults BRFSS, 1990, 2000, 2010
(*BMI 30, or about 30 lbs. overweight for 5’4” person) 1990 2000 2010 No Data <10% %–14% %–19% %–24% %–29% ≥30%
 No Data <10% 10%–14% 15%–19% 20%–24% 25%–29% ≥30%")
5
What to do when the obese patient becomes critically ill?

6
Feeding the Obese Critically Ill (BMI>30)
Canadians Insufficient evidence Americans* Based on expert consensus, the goal should not exceed 65%–70% of target energy requirements as measured by IC. If IC is unavailable, use weight-based equation 11–14 kcal/kg actual body weight per day for patients with BMI in the range of 30–50 and 22–25 kcal/kg ideal body weight per day for patients with BMI >50. Protein should be provided in a range from 2.0 g/kg ideal body weight per day for patients with BMI of 30–40 up to 2.5 g/kg ideal body weight per day for patients with BMI ≥40. Europeans (silent) *McClave CCM 2016
 *McClave CCM")
7
RCTs of Hypocaloric Nutrition in Obesity (1)
16 hospitalized obese patients requiring PN (? ICU, ‘mild-moderate stress’) Defined obesity as >130% IBW Goal was to show equal nitrogen balance in hypocaloric group (14 kcals/kg actual wt) vs control (25 kcals/kg actual wt) Protein intake was the same (2.0g/kg IBW) Outcomes: No difference in % of patients achieving positive Nitrogen Balance Weight change did not differ significantly between groups Infections not measured No difference in LOS or mortality Burge JPEN 1994
 Defined obesity as >130% IBW. Goal was to show equal nitrogen balance in hypocaloric group (14 kcals/kg actual wt) vs control (25 kcals/kg actual wt) Protein intake was the same (2.0g/kg IBW) Outcomes: No difference in % of patients achieving positive Nitrogen Balance. Weight change did not differ significantly between groups. Infections not measured. No difference in LOS or mortality. Burge JPEN")
8
RCTs of Hypocaloric Nutrition in Obesity (2)
30 hospitalized obese patients (13 in the ICU) Defined obesity as BMI >35 Hypocaloric group -13.6kcals/kg actual wt Control group – 22.5 kcals/kg actual wt Protein intake was the same (2 g/kg IBW) Outcomes: No difference in % of patients achieving positive Nitrogen Balance Weight change did not differ significantly between groups Infections not measured No difference in LOS or mortality Choban et al, Am J Clin Nutr Sep;66(3)
 Defined obesity as BMI >35. Hypocaloric group -13.6kcals/kg actual wt. Control group – 22.5 kcals/kg actual wt. Protein intake was the same (2 g/kg IBW) Outcomes: No difference in % of patients achieving positive Nitrogen Balance. Weight change did not differ significantly between groups. Infections not measured. No difference in LOS or mortality. Choban et al, Am J Clin Nutr Sep;66(3)")
9
Clinical Inferences to ICU Patients?
N=46 (13 ICU patients) Focus was on patients requiring PN, says nothing about patients on EN Focus was on NB, other outcomes not assessed or underpowered. Burge JPEN 1994 Choban et al, Am J Clin Nutr Sep;66(3)
 Focus was on patients requiring PN, says nothing about patients on EN. Focus was on NB, other outcomes not assessed or underpowered. Burge JPEN Choban et al, Am J Clin Nutr Sep;66(3)")
10
Is there sufficient evidence that should inform one prescription on how ALL obese patients should be fed?

11
Extreme Obesity and Outcomes in Critically Ill Patients
Analysis of data from multicenter international observational study of ICU nutrition practices in 2007 and 2008 Increased obesity= increased risk of prolongation of stay Martino Chest 2011;140:1198

12
Not all critically ill obese patients are the same: the influence of prior co-morbidities.
Prospective observational study of 183 critically ill patients had a BMI ≥ 30 Raham ISRN Obesity 2012

13
2 or more co- morbidities
Not all critically ill obese patients are the same: the influence of prior co-morbidities. 0-1 co-morbidity (n=38) 2 or more co- morbidities (n=145) p values Discharged alive from ICU by day 28 36 (94.7%) 112 (77.2%) 0.02 Maximum SOFA score 7.5[5.0 to 11.0] 9.0[6.0 to 13.0] 0.04 Delta SOFA score 1.5[0.0 to 3.0] 2.0[1.0 to 5.0] 0.07 Number of days on MV 4.0[2.0 to 7.0] 0.09 Number of days in ICU 3.0[3.0 to 11.0] 6.0[3.0 to 10.0] ICU free days in the first 28 days 24.5[17.0 to 25.0] 20.0[3.0 to 24.0] 0.003 Mortality at Day 14 2 (5.3%) 24 (16.6%) 0.08 Mortality at Day 28 30 (20.7%) 0.03 Raham ISRN Obesity 2012
 2 or more co- morbidities. (n=145) p values. Discharged alive from ICU by day (94.7%) 112 (77.2%) Maximum SOFA score. 7.5[5.0 to 11.0] 9.0[6.0 to 13.0] Delta SOFA score. 1.5[0.0 to 3.0] 2.0[1.0 to 5.0] Number of days on MV. 4.0[2.0 to 7.0] Number of days in ICU. 3.0[3.0 to 11.0] 6.0[3.0 to 10.0] ICU free days in the first 28 days. 24.5[17.0 to 25.0] 20.0[3.0 to 24.0] Mortality at Day (5.3%) 24 (16.6%) Mortality at Day (20.7%) Raham ISRN Obesity")
14
Not all critically ill obese patients are the same: the influence of prior co-morbidities.
In the adjusted analysis, compared to patients with limited co-morbidities, obese patients with multiple co-morbidities were: more likely to die at 28 days (OR 4.28, 95%CI, CI 0.92, 20.02, p=0.06) tended to have longer ICU duration (3.06 days, standard error [SE] 2.28, p=0.18) and had significantly fewer ICU free days in the first 28 days (-3.92 days, SE 1.83, p=0.03). Raham ISRN Obesity 2012
 tended to have longer ICU duration (3.06 days, standard error [SE] 2.28, p=0.18) and. had significantly fewer ICU free days in the first 28 days (-3.92 days, SE 1.83, p=0.03). Raham ISRN Obesity")
15
ICU Obese patients are not all created equal…should we expect the impact of nutrition therapy to be the same across all patients?

16
Not all Obest ICU Patient the same!
Low Risk 34 year former football player, BMI 35 otherwise healthy involved in motor vehicle accident Mild head injury and fractured R leg requiring ORIF High Risk 79 women BMI 35 PMHx COPD, poor functional status, frail Admitted to hospital 1 week ago with CAP Now presents in respiratory failure requiring intubation and ICU admission

17
Muscle Matters! Skeletal muscle mass predicts ventilator-free days, ICU-free days, and mortality in elderly ICU patients Patients > 65 years with an admission abdominal computed tomography scan and requiring intensive care unit stay at a Level I trauma center in were reviewed. Muscle cross-sectional area at the 3rd lumbar vertebra was calculated and sarcopenia identified using sex-specific cut-points. Muscle cross-sectional area was then related to clinical parameters including ventilator-free days, ICU-free days, and mortality. Moisey Crit Care 2013 Sept;17(5):R206
:R206.")
18
Body Composition Lab CT Imaging Analysis
Skeletal Muscle Adipose Tissue

19
Physical Characteristics of Patients
N=149 patients Median age: 79 years old 57% males ISS: 19 Prevalence of sarcopenia: 71%

20
Sarcopenic Patients (n=106) Non-sarcopenic Patients (n=43)
BMI Characteristics All Patients Sarcopenic Patients (n=106) Non-sarcopenic Patients (n=43) BMI (kg/m2) 25.8 (22.7, 28.2) 24.4 (21.7, 27.3) 27.6 (25.5, 30.4) Underweight, % 7 9 2 Normal Weight, % 37 44 19 Overweight, % 42 38 51 Obese, % 15 28 Almost half the sarcopenic patients were overweight
 Non-sarcopenic Patients (n=43) BMI (kg/m2) 25.8 (22.7, 28.2) 24.4 (21.7, 27.3) 27.6 (25.5, 30.4) Underweight, % Normal Weight, % Overweight, % Obese, % Almost half the sarcopenic patients were overweight.")
21
Low muscle mass associated with mortality
Proportion of Deceased Patients P-value Sarcopenic patients 32% 0.018 Non-sarcopenic patients 14%

22
Muscle mass is associated with ventilator-free and ICU-free days
All Patients Sarcopenic Patients Non-Sarcopenic Patients P-value Ventilator-free days 25 (0,28) 19 (0,28) 27 (18,28) 0.004 ICU-free days 19 (0,25) 16 (0,24) 23 (14,27) 0.002
 19 (0,28) 27 (18,28) ICU-free days. 19 (0,25) 16 (0,24) 23 (14,27)")
23
What does Nutrition Risk Assessment look like for the obese critically ill?
Functional Impairment (reduced mobility and strength) Chronic Malnutrition (?Sarcopenia) Acute Starvation (Reduced po intake, pre ICU hospital stay) Degree of Obesity (BMI) Nutrition Status micronutrient levels - immune markers - muscle mass Pre-existing Co-morbidities (Metabolic consequences) Severity of Illness (APACHE, SOFA, IL-6) Risk Status High risk= high risk of death and greater likelihood of benefit from Nutrition
 Chronic Malnutrition. ( Sarcopenia) Acute Starvation. (Reduced po intake, pre ICU hospital stay) Degree of Obesity. (BMI) Nutrition Status. micronutrient levels - immune markers - muscle mass. Pre-existing Co-morbidities. (Metabolic consequences) Severity of Illness. (APACHE, SOFA, IL-6) Risk Status. High risk= high risk of death and greater likelihood of benefit from Nutrition.")
24
A Proposed Clinical Staging System for Obesity (non-critically ill)
Increasing complications Increasing aggressiveness We need to adapt this way of thinking to the ICU setting! Sharma Int J of Obesity 2009;33:289

25
Start EN within 24-48 hrs of admission to ICU
Optimal Amount of Protein and Calories for Critically Ill Patients

26
Bias and accuracy of common estimation methods for
resting metabolic rate in mechanically ventilated critically ill patients Indirect calorimetry is the comparator. Bias is the 95th percentile of the difference between estimated and measured. Negative values represent underestimates. Intervals that exclude zero indicate statistically significant bias. Accuracy is the percentage of patients whose estimated value falls within 10% of the measured value by indirect calorimetry. ACCP, American College of Chest Physicians (25 kcal/kg body wt); HBE, Harris Benedict equation; MAW, metabolically active body weight [(Actual wt – Ideal wt) 0.25þIdeal wt]; Faisy, Wt (8)þHt (14)þMinute ventilation (32)þTemperature (94) – 4834; Penn State, Mifflin (0.96)þMaximum body temperature (167)þMinute ventilation (31) – 6212; Penn State modified, Mifflin (0.71)þMaximum body temperature (85)þMinute ventilation (64) – 3085. For the Penn State equation, overall accuracy improves to 73% if the modified equation results in older obese patients are substituted for the results of the original equation in this group. Penn State or modified Penn State if >60 recommended by experts* Curr Opin Crit Care 2012, 18:174–177 *Choban JPEN 2013
; HBE, Harris Benedict equation; MAW, metabolically active body weight [(Actual wt – Ideal. wt) 0.25þIdeal wt]; Faisy, Wt (8)þHt (14)þMinute ventilation (32)þTemperature (94) – 4834; Penn State, Mifflin (0.96)þMaximum body temperature. (167)þMinute ventilation (31) – 6212; Penn State modified, Mifflin (0.71)þMaximum body temperature (85)þMinute ventilation (64) – For the Penn State equation, overall accuracy improves to 73% if the modified equation results in older obese patients are substituted for the results of the original. equation in this group. Penn State or modified Penn State if >60 recommended by experts* Curr Opin Crit Care 2012, 18:174–177. *Choban JPEN")
27
Caloric debt associated with:
Increasing Calorie Debt Associated with worse Outcomes Caloric Debt Adequacy of EN Caloric debt associated with: Longer ICU stay Days on mechanical ventilation Complications Mortality Rubinson CCM 2004; Villet Clin Nutr 2005; Dvir Clin Nutr 2006; Petros Clin Nutr 2006

28
Point prevalence survey of nutrition practices in ICU’s around the world conducted Jan. 27, 2007
Enrolled 2772 patients from 158 ICU’s over 5 continents Included ventilated adult patients who remained in ICU >72 hours

29
How are Obese Patients Actually Being Fed?
Total 25-<30 30-<35 35<-40 >=40 P-value Nutritional Prescription Mean Energy [Kcal/kg/day] (SD) 24.0 (5.8) 23.8 (3.7) 20.2 (3.4) 17.9 (2.8) 15.0 (4.0) <0.0001 Mean Protein [grams/kg/day] (SD) 1.2 (0.3) 1.0 (0.2) 0.9 (0.2) 0.8 (0.3) Nutrition Received 14.0 (7.6) 13.6 (6.7) 11.2 (5.9) 9.8 (5.1) 8.1 (4.4) 0.6 (0.4) 0.6 (0.3) 0.5 (0.3) 0.4 (0.3) Received EN protein supplements 173 (6.2%) 50 (6.1%) 28 (7.1%) 17 (10.5%) 22 (12.9%) 0.0002
 24.0 (5.8) 23.8 (3.7) 20.2 (3.4) 17.9 (2.8) 15.0 (4.0) < Mean Protein [grams/kg/day] (SD) 1.2 (0.3) 1.0 (0.2) 0.9 (0.2) 0.8 (0.3) Nutrition Received (7.6) 13.6 (6.7) 11.2 (5.9) 9.8 (5.1) 8.1 (4.4) 0.6 (0.4) 0.6 (0.3) 0.5 (0.3) 0.4 (0.3) Received EN protein supplements. 173 (6.2%) 50 (6.1%) 28 (7.1%) 17 (10.5%) 22 (12.9%)")
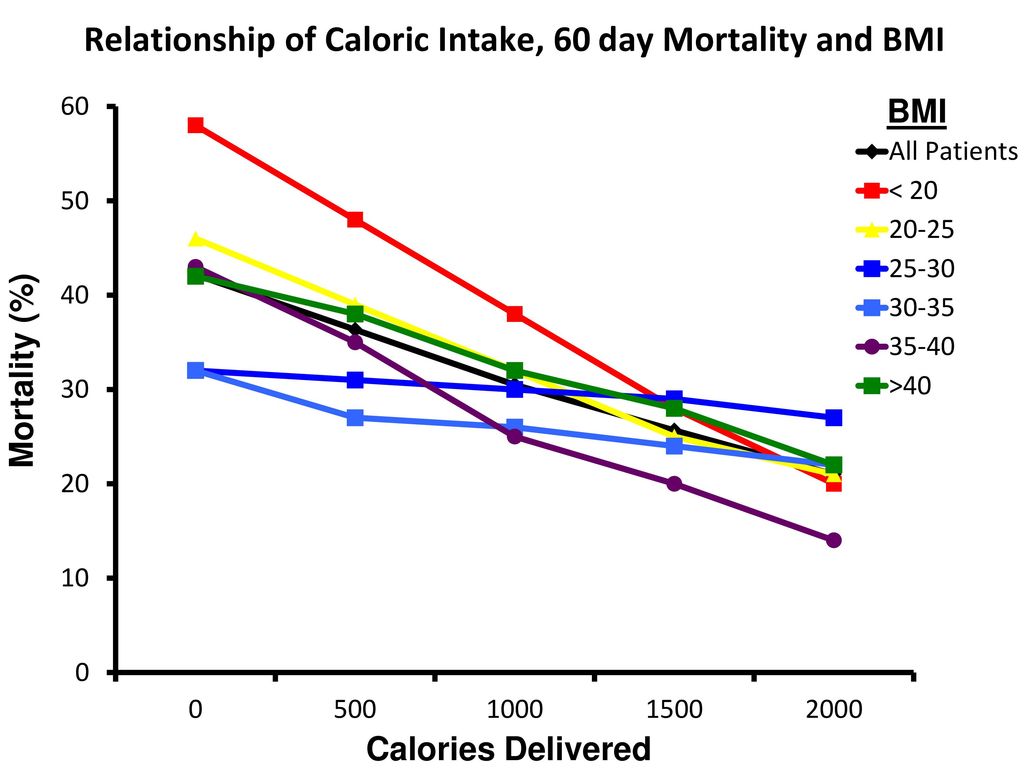
30
Hypothesis There is a relationship between amount of energy and protein received and clinical outcomes (mortality and # of days on ventilator) The relationship is influenced by nutritional risk BMI is used to define chronic nutritional risk

32
How do we increase nutrition delivery in the Obese Patient?
Enterally High protein (low NPC:N ratio solutions) Protein supplements PEP uP protocol Parenterally IV amino acids Supplemental PN?
 Protein supplements. PEP uP protocol. Parenterally. IV amino acids. Supplemental PN")
33
R The TOP UP Trial Primary Outcome 60-day mortality PN for 7 days
High-risk ICU patients Stratified by: Site BMI Med vs Surg R BMI <25 60-day mortality BMI >35 EN Alone

34
HYPOTHESIS Increased early energy and protein delivery with PN+EN to underweight (BMI < 25) and obese (BMI> 35) critically ill patients will result in improved survival at 60 day versus standard EN alone 34
 and obese (BMI> 35) critically ill patients will result in improved survival at 60 day versus standard EN alone. 34.")
35
Objectives of the Pilot Study
Not powered to look at clinical outcomes Primary Aim: Difference in the calories and protein received between the control and intervention groups Secondary Aims Confirm the feasibility of the trial (estimate recruitment rate) Confirm feasibility of the intervention. Tertiary Aim explore the effect of differential effects of calorie and protein delivery on muscle mass and physical function
 Confirm feasibility of the intervention. Tertiary Aim. explore the effect of differential effects of calorie and protein delivery on muscle mass and physical function.")
36
Eligibility Criteria Inclusion Criteria
Critically ill adult patients (>18 years old) Expected to require mechanical ventilation > 48 hrs Expected ICU dependency of 5 or more days Are on enteral nutrition or are to be initiated on enteral nutrition within 7 days of ICU admission and Have a BMI < 25 or >35, based on pre-ICU actual or estimated dry weight.
 Expected to require mechanical ventilation > 48 hrs. Expected ICU dependency of 5 or more days. Are on enteral nutrition or are to be initiated on enteral nutrition within 7 days of ICU admission and. Have a BMI < 25 or >35, based on pre-ICU actual or estimated dry weight.")
37
Study Intervention Olimel N9 in 3 Chamber bag 1000 ml size
20% lipid emulsion containing a mixture of refined olive oil (80%) and refined soya oil (20%). High nitrogen concentration (14% AA) 27.5% glucose solution 1.1 cal/ml
 and refined soya oil (20%). High nitrogen concentration (14% AA) 27.5% glucose solution. 1.1 cal/ml.")
38
Study Intervention Both groups fed enterally started as early as possible (as per standard care) EN solution will be cal/ml EN started at 25 ml/hr and increased by at least 25 mls q 4 hrs until goal achieved Upon enrollment, study dietitians calculated the total volume/24 hours of either EN or PN required to receive goal calories and protein. The PN solution was started at 25 ml/hr and increase by 25ml/hr increments every 4 hours as tolerated (monitoring blood glucose every 4 hours and electrolytes every twelve hours) till 100% of goal calories are reached. As PN rate increased, EN rate decreased (paired feeding)
 till 100% of goal calories are reached. As PN rate increased, EN rate decreased (paired feeding)")
39
Results

40
Patient Demographics, BMI >35
EN (N=35) EN+PN (N=25) p value Age 56.0±13.4 ( ) 56.9±17.6 ( ) 0.67 Sex 0.46 Male 13 (37.1%) 7 (28.0%) Female 22 (62.9%) 18 (72.0%) APACHEII score 20.8± 7.3 ( ) 20.9± 5.2 ( ) 0.98 BMI 46.9± 9.5 ( ) 47.1± 9.7 ( ) 0.96 Charlson Comorbidity Index 1.9± 2.1 ( ) 1.4± 1.7 ( ) 0.49 Type of Admission 0.93 Medical 20 (57.1%) 14 (56.0%) Surgical 15 (42.9%) 11 (44.0%) Primary Diagnosis 0.08 Other 3 (8.6%) 1 (4.0%) Cardiovascular/Vascular 1 (2.9%) 5 (20.0%) Respiratory 11 (31.4%) 6 (24.0%) Gastrointestinal 4 (11.4%) Neurologic 5 (14.3%) 0 (0.0%) Sepsis 7 (20.0%) Trauma 2 (5.7%) Metabolic Hematologic
 EN+PN (N=25) p value. Age. 56.0±13.4 ( ) 56.9±17.6 ( ) Sex Male. 13 (37.1%) 7 (28.0%) Female. 22 (62.9%) 18 (72.0%) APACHEII score. 20.8± 7.3 ( ) 20.9± 5.2 ( ) BMI. 46.9± 9.5 ( ) 47.1± 9.7 ( ) Charlson Comorbidity Index. 1.9± 2.1 ( ) 1.4± 1.7 ( ) Type of Admission Medical. 20 (57.1%) 14 (56.0%) Surgical. 15 (42.9%) 11 (44.0%) Primary Diagnosis Other. 3 (8.6%) 1 (4.0%) Cardiovascular/Vascular. 1 (2.9%) 5 (20.0%) Respiratory. 11 (31.4%) 6 (24.0%) Gastrointestinal. 4 (11.4%) Neurologic. 5 (14.3%) 0 (0.0%) Sepsis. 7 (20.0%) Trauma. 2 (5.7%) Metabolic. Hematologic.")
41
Nutritional Adequacy* (%), BMI >35
Primary Outcome Nutritional Adequacy* (%), BMI >35 EN (n=34) EN+PN (n=24) Difference mean (95% CI) p-value Adequacy by EN route Calories first week 68±24 69±24 1 (-12 to 13) 0.915 Protein in first week 62±21 61±19 -2 (-12 to 9) 0.754 Adequacy by EN or PN route 99±10 31 (22 to 40) <.001 87±13 25 (16 to 34) *refers to % prescribed volume received
, BMI >35. EN (n=34) EN+PN (n=24) Difference mean. (95% CI) p-value. Adequacy by EN route. Calories first week. 68±24. 69±24. 1 (-12 to 13) Protein in first week. 62±21. 61± (-12 to 9) Adequacy by EN or PN route. 99± (22 to 40) < ± (16 to 34) *refers to % prescribed volume received.")
42
Enteral Nutrition Only (n=35)
Clinical Outcomes Enteral Nutrition Only (n=35) Enteral Nutrition plus Supplemental PN (n=25) p values Duration of Mechanical Ventilation (days) 8.3 [6.3 to 13.2] 7.7 [3.3 to 14.7] 0.68 Length of stay in ICU (days) 14.5 [9.0 to 18.7] 12.9 [7.9 to 17.0] 0.62 Length of stay in hospital (days) 21.0 [16.6 to 33.0] 23.9 [20.9 to 29.7] 0.53 ICU mortality 6 (17.1%) 4 (16.0%) 0.91 Hospital mortality Time to discharge alive from hospital 30.5 [17.1, 82.7] 27.1 [22.0, 83.9] 0.80 6 months mortality 7 (20.0%) 6 (24.0%) 0.71 Double check ICU and hospital mortality- it is the same ANSWER FROM XURAN: Yes, I double checked the data and confirmed that the ICU and hospital mortality rate are the same.
 Enteral Nutrition plus Supplemental PN. (n=25) p values. Duration of Mechanical Ventilation (days) 8.3 [6.3 to 13.2] 7.7 [3.3 to 14.7] Length of stay in ICU (days) 14.5 [9.0 to 18.7] 12.9 [7.9 to 17.0] Length of stay in hospital (days) 21.0 [16.6 to 33.0] 23.9 [20.9 to 29.7] ICU mortality. 6 (17.1%) 4 (16.0%) Hospital mortality. Time to discharge alive from hospital [17.1, 82.7] 27.1 [22.0, 83.9] months mortality. 7 (20.0%) 6 (24.0%) Double check ICU and hospital mortality- it is the same. ANSWER FROM XURAN: Yes, I double checked the data and confirmed that the ICU and hospital mortality rate are the same.")
43
Performance-based Measures
Enteral Nutrition Only (n=35) EN+PN (n=25) P-value Hand Grip at Hospital discharge Patient died 6 (17.1%) 4 (16.0%) Unable to do 5 (14.3%) 1 (4.0%) Refused to Do 0 (0.0%) Done 12 (34.3%) 12 (48.0%) Missed 9 (25.7%) 3 (12.0%) Unknown reason 1 (2.9%) Use ICU 2 (5.7%) Hand grip strength 4 [unable-19] 20 [unable-40] 0.16 6-min Walk test at hospital discharge 16 (45.7%) 4 (11.4%) 7 (20.0%) 2 (8.0%) 2 (8.0 %) 6-min walk test unable [unable-unable] unable [unable-123] 0.75 Values that were missed or have unknown reason for not done are excluded. The remaining values are ranked as died<unable<refused=0<other non-zero values. The p-values are calculated by the rank-based Wilcoxon-Rank Sum tests.
 EN+PN. (n=25) P-value. Hand Grip at Hospital discharge. Patient died. 6 (17.1%) 4 (16.0%) Unable to do. 5 (14.3%) 1 (4.0%) Refused to Do. 0 (0.0%) Done. 12 (34.3%) 12 (48.0%) Missed. 9 (25.7%) 3 (12.0%) Unknown reason. 1 (2.9%) Use ICU. 2 (5.7%) Hand grip strength. 4 [unable-19] 20 [unable-40] min Walk test at hospital discharge. 16 (45.7%) 4 (11.4%) 7 (20.0%) 2 (8.0%) 2 (8.0 %) 6-min walk test. unable [unable-unable] unable [unable-123] Values that were missed or have unknown reason for not done are excluded. The remaining values are ranked as died<unable<refused=0<other non-zero values. The p-values are calculated by the rank-based Wilcoxon-Rank Sum tests.")
44
Enteral Nutrition Only (n=35)
Other Outcomes Enteral Nutrition Only (n=35) EN+PN (n=25) Difference mean (95% CI) p values Barthel index (change from baseline) -32.2±36.6 ( ) -31.3±27.0 ( ) 1 (-24,22) 0.90 SF 36 score (changes from baseline to 6 months) PHYSICAL FUNCTIONING -12.1±49.0 ( ) 3.5±29.3 ( ) 16 (-51, 20) 0.51 ROLE-PHYSICAL -5.0±54.3 ( ) -10.0±54.3 ( ) -5 (-41, 51) 0.76 STANDARDIZED PHYSICAL COMPONENT SCALE -1.6±16.1 ( ) 1.6±7.7 ( ) 3 (-15,8) 0.35 US thickness Baseline 1.9± 0.7 ( ) 1.7± 0.7 ( ) 0 (0,1) 0.12 Week #2 1.7± 0.7 ( ) 1.6± 0.8 ( ) 0.41 Week #3 1.8± 0.7 ( ) 1.7± 1.1 ( ) 0 (-1,1) 0.75 Week #4 1.3± 0.4 ( ) 1.4± 0.3 ( ) 0.81 Change from Baseline -0.1±0.6 ( ) -0.2±0.5 ( ) 0 (0,0) 0.71
 EN+PN. (n=25) Difference mean. (95% CI) p. values. Barthel index (change from baseline) -32.2±36.6. ( ) -31.3±27.0. ( ) 1 (-24,22) SF 36 score (changes from baseline to 6 months) PHYSICAL FUNCTIONING ±49.0 ( ) 3.5±29.3 ( ) 16 (-51, 20) ROLE-PHYSICAL. -5.0±54.3 ( ) -10.0±54.3 ( ) -5 (-41, 51) STANDARDIZED PHYSICAL COMPONENT SCALE. -1.6±16.1 ( ) 1.6±7.7 ( ) 3 (-15,8) US thickness. Baseline. 1.9± 0.7 ( ) 1.7± 0.7 ( ) 0 (0,1) Week #2. 1.7± 0.7 ( ) 1.6± 0.8 ( ) Week #3. 1.8± 0.7 ( ) 1.7± 1.1 ( ) 0 (-1,1) Week #4. 1.3± 0.4 ( ) 1.4± 0.3 ( ) Change from Baseline. -0.1±0.6 ( ) -0.2±0.5 ( ) 0 (0,0)")
45
Conclusions of TOP uP study
Topping UP obese critically ill patient feasible Possible signals of benefit Hand grip strength SF 36 PF need to reduce missing data

46
In Conclusion Not all Obese ICU patients are the same in terms of ‘risk’- need to develop and validate risk assessment tools in this population Iatrogenic underfeeding is harmful to some Obese ICU patients or some will benefit more from aggressive feeding (avoiding protein/calorie debt) Aggressive use of EN (high protein diets) and protein supplements indicated Supplemental PN may be beneficial in some
 Aggressive use of EN (high protein diets) and protein supplements indicated. Supplemental PN may be beneficial in some.")
Similar presentations


 Brought to you by www.criticalcarenutrition.com and your ICU Dietitianwww.criticalcarenutrition.com Thanks for nibbling.>")


,>")