Download presentation
Presentation is loading. Please wait.

1
Bridging the Divide Between Health Care and Aging Services Health Status Disparities among Older Adults Attending NYC Senior Centers Marianne C. Fahs, PhD MPH Professor Rose Dobrof Acting Executive Director Brookdale Center for Healthy Aging and Longevity Hunter College, City University of New York

2
Urban Aging

3
Public Health System Inequalities Social and Economic Immigration Policy National/State/Local Urbanization Health Care System National/State/Local Characteristics Conceptual Framework of Urban Aging Neighborhood Characteristics Physical Environment Transportation Housing Education Environmental Risks Crime/Vandalism Accessibility to resources: ● products ● services ● community organizations Social Environment Social Cohesion Ethnic Enclaves Civic Participation Community-based organizations Such as Senior Centers Social resources Racial/ethnic/economic segregation Health Behaviors Social Support Access Use of Health Services Acculturation Engagement in community activities Health & Economic Outcomes: Well-Being Functionality Productivity Pathways Age Gender SES Genetics Individual/Biological Characteristics

4
Economic Myths of Aging Myth #1: Preventive medicine is not cost effective after age 65 Myth #2: The elderly are a drain on the health care system Myth #3: The elderly are a drain on the economy Myth #4: Increased longevity will cause increased social costs associated with degenerative disease and disability

5
What can Economics tell us? A 10 year gain in life expectancy translates into nearly 1 additional percentage point of annual income growth Bloom DL and Canning D. The Health and Wealth of Nations. Science 287. pp.1207-1209. 2000.

6
Health to income – lots of oomph!!! Income Health

7
Economic Gains from Longevity Gains in life expectancy from 1970-2000 = + $3.2 trillion per year to National Wealth! Murphy and Topel, NBER Working Paper No. w11405, June 2005.

8
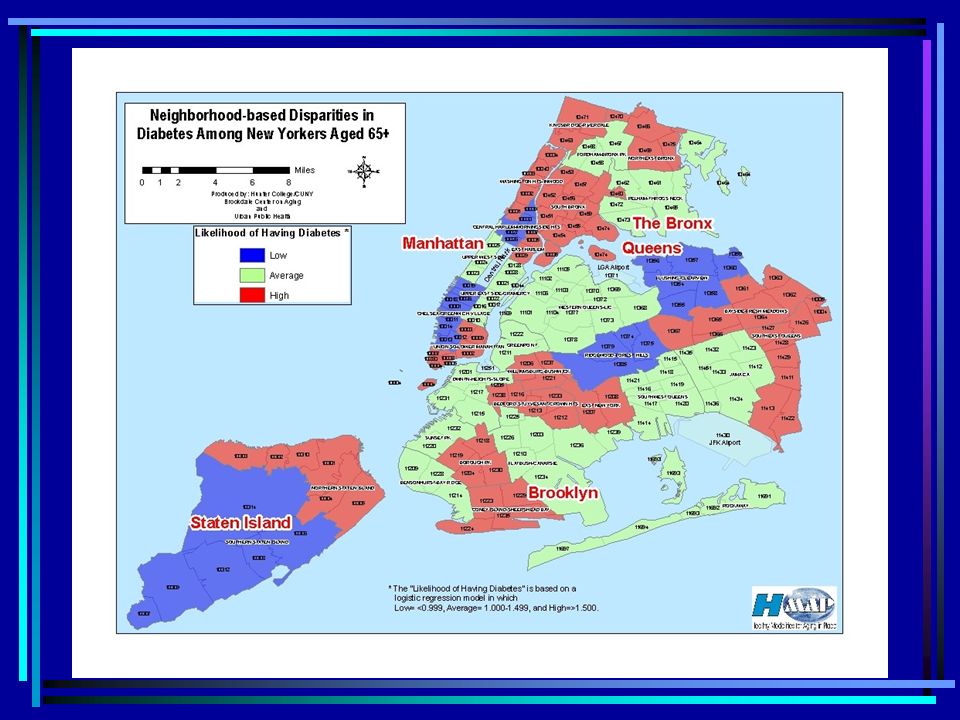
Life Expectancy Varies By Neighborhood Income Level

9
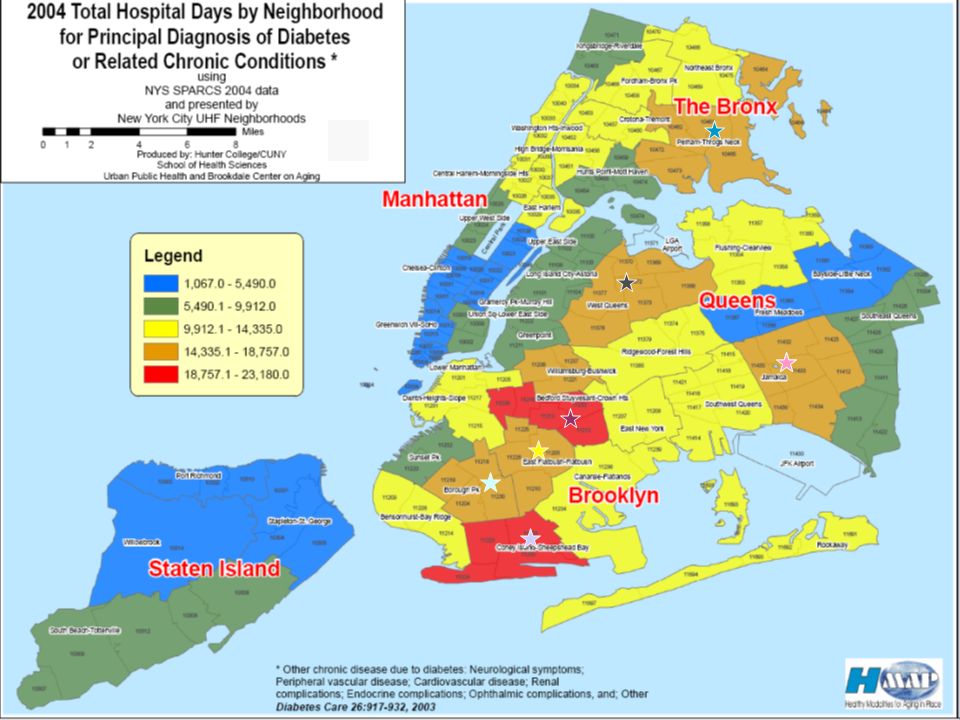
Percentage increase in NYC diabetes hospitalization rates by neighborhood income, 1995 to 2005. Source: Assessing and Addressing Income Disparities in the Health of New Yorkers. Office of the New York City Comptroller. September 2007

10
STRIKING DISPARITIES Number of hospitalizations per 100,000 Bottom sixth = 204.2 5th sixth = 78.0 4th sixth = 66.5 3rd sixth = 36.2 2nd sixth = 24.0 Top sixth = 0.6

11
$ 2,000,000,000 per year! (in 2004 dollars) Hospital Charges in New York City For Diabetes and Related Complications
 Hospital Charges in New York City For Diabetes and Related Complications.")
15
Controlling for Age, Sex, Race/Ethnicity, Education

16
Re-inventing Senior Centers? A community focal point on aging where older persons as in individuals or in groups come together for services and activities that enhance their dignity, support their independence and encourage their involvement in and with the community. -The National Council on Aging (1979)
.")
17
What’s missing? Health!

18
How Many? No Formal Census US AOA estimate (2004): 10,000-16,000
: 10,000-16,000")
19
Research to date is limited for policy and practice

20
“To have evidence-based practice you need practice- based evidence.” [2] [2] [2] Green LW. Public Health Asks of Systems Science: To Advance Our Evidence-based Practice, Can You Help Us Get More Practice-Based Evidence? American Journal of Public Health 96:3. 2006. 406-409.[2]
![To have evidence-based practice you need practice- based evidence. [2] [2] [2] Green LW.](http://images.slideplayer.com/42/11569265/slides/slide_20.jpg "Public Health Asks of Systems Science: To Advance Our Evidence-based Practice, Can You Help Us Get More Practice-Based Evidence. American Journal of Public Health 96: [2].")
21
Senior Center Health Indicators Demonstration Project Representative sample of centers and participants Year 1 = Baseline Health Indicators Assessment Year 2 = Evidence-based interventions in collaboration with Senior Centers Year 3 = Follow up Health Indicators Assessment

22
The structured survey instrument Standardized questionnaire items from validated national and local surveys functional status mental and physical health status social networks health literacy access to health care cancer screenings demographic and socioeconomic characteristics

23
PILOT = TEN SENIOR CENTERS stratified by Borough and Race/Ethnicity Borough Site Race/Ethnicity Brooklyn Ft GreeneBlack UnitedLatino BronxDora and Harry SimonWhite James MonroeBlack QueensKorean AmericanKorean United HinduGuyanese Staten IslandCassidy ColesWhite West Brighton Black, Latino, and White Manhattan Beatrice Lewis Black City HallChinese

24
Physical Health Score (SF 36)
")
25
Mental Health Score (SF 36)
")
26
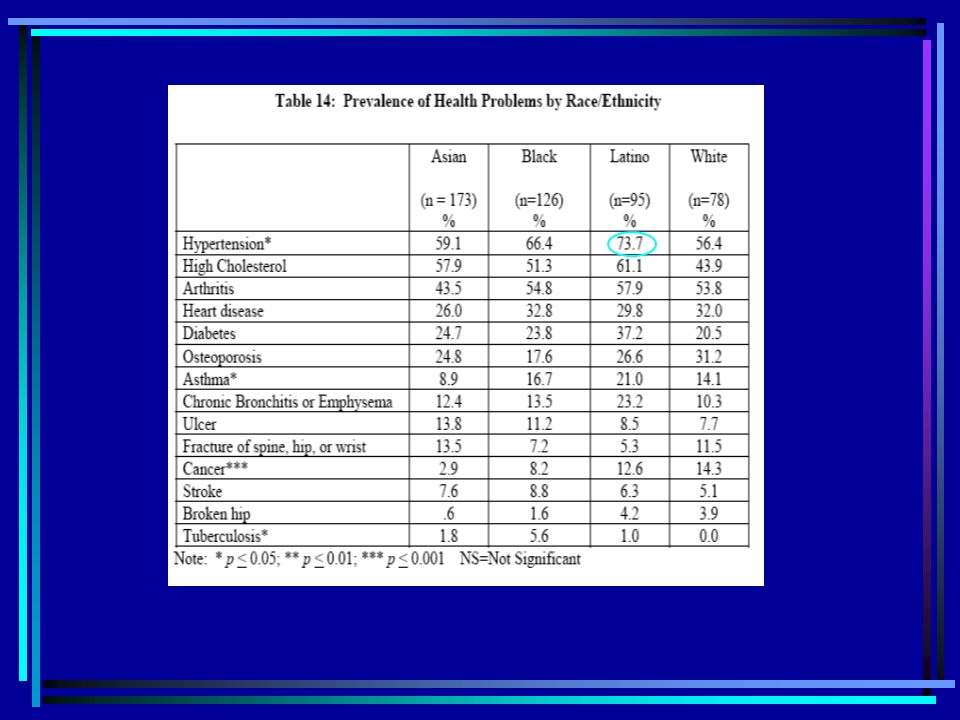
SF 36 By Race/Ethnicity

27
PHQ-2 by Race/Ethnicity

33
“The aging of the U.S. population is one of the major public health challenges we face in the 21st century.” [1] [1] [1] Julia Louis Gerberding, MD, MPH, Director, Center for Disease Control and Prevention, U. S. Department of Health and Human Services, quoted in The State of Aging and Health in America 2007. Centers for Disease Control and Prevention, and the Merck Company Foundation.

34
Thank you!

Similar presentations