Download presentation
Presentation is loading. Please wait.

1
Health Inequalities

2
South Tyneside Life Expectancy Gap Life Expectancy – Males Local Value England England England average worst best 74.8 76.9 72.5 82.2 Females 79.9 81.1 78.1 86.2

3
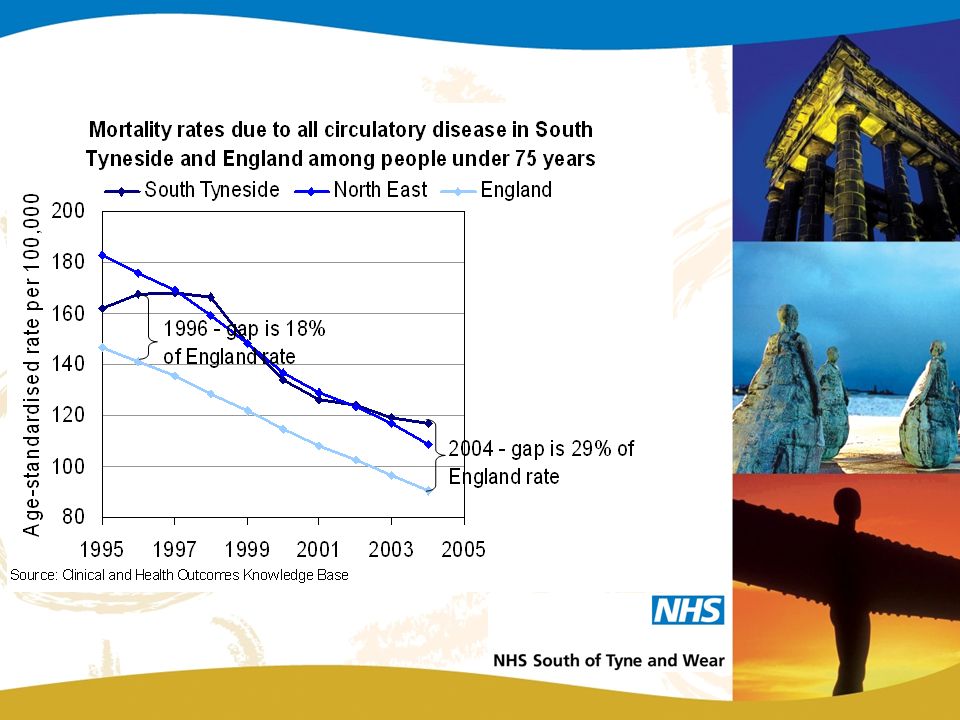
Monitoring Health Improvement in South of Tyne and Wear (cont.) The gap between South Tyneside and England
 The gap between South Tyneside and England")
4
Breakdown of Life Expectancy Gap Males (2.1 years) 32% all cancers (37% lung cancer) 27% circulatory disease (69% CHD) 10% external causes of injury and poisoning 7% respiratory disease (45% COPD) 6% digestive disease (57% liver disease) 6% mental health and behavioural disorders 3% infectious diseases 8% Other
 32% all cancers (37% lung cancer) 27% circulatory disease (69% CHD) 10% external causes of injury and poisoning 7% respiratory disease (45% COPD) 6% digestive disease (57% liver disease) 6% mental health and behavioural disorders 3% infectious diseases 8% Other")
5
Breakdown of Life Expectancy Gap Females (1.2 years) 37% all cancers (64% lung cancer) 28% circulatory disease (58% CHD) 11% digestive (47% liver cirrhosis) 7% respiratory disease ( 100% COPD) 6% external causes of injury 3% mental health and behavioural problems 2% infectious diseases 6% Other
 37% all cancers (64% lung cancer) 28% circulatory disease (58% CHD) 11% digestive (47% liver cirrhosis) 7% respiratory disease ( 100% COPD) 6% external causes of injury 3% mental health and behavioural problems 2% infectious diseases 6% Other")
9
Cancer Prevalence

10
Asthma Prevalence

11
South Tyneside

15
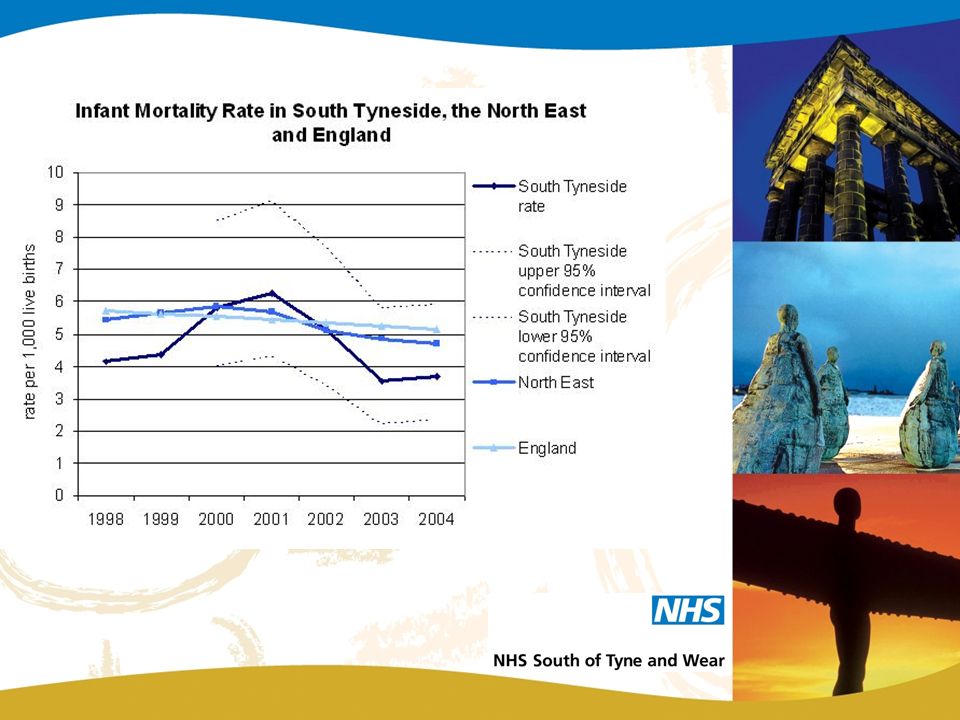
Targets Exceeded target trajectory for cancer mortality In line with target trajectory for CHD mortality Reduced CHD mortality in wards with highest prevalence Reduced cancer mortality in all of the NRF areas. Suicide lower than Regional and National Average Infant Mortality lower than Regional and National Average

16
0% 1% 2% 3% 4% 5% 6% 7% 8% 9% 10% 11% % by which life expectancy gap would be reduced 1.0% - Double capacity of smoking cessation clinics 0.7% - statin therapy 2.3% - Secondary prevention of CVD: additional 15% coverage of effective therapies 35-74 years 1.0% - 40% coverage amongst hypertensives Primary prevention of CVD in hypertensives under 75 years 0.2% - smoking reduction in clinics as at present 1.4% - Secondary prevention of CVD; 75% coverage of 35-74 years 1.2% - 40% coverage amongst hypertensives 0.7% - statin therapy Primary prevention of CVD in hypertensives 75 years + 2.1% - Other (to be locally determined) including; early detection of cancer, respiratory diseases, alcohol-related diseases, infant mortality Primary prevention of CVD among hypertensives under 75 years 0.2% - statin therapy 0.2% - 20% coverage antihypertensive Universalist Targeted Impact of interventions on the Life Expectancy Gap Among Males for the Spearhead Group
 including; early detection of cancer, respiratory diseases, alcohol-related diseases, infant mortality Primary prevention of CVD among hypertensives under 75 years 0.2% - statin therapy 0.2% - 20% coverage antihypertensive Universalist Targeted Impact of interventions on the Life Expectancy Gap Among Males for the Spearhead Group")
17
Impact of interventions on the Life Expectancy Gap Among Females for the Spearhead Group 0% 2% 4% 6% 8% 10% 12% 14% 16% % by which life expectancy gap would be reduced 1.0% - Double capacity of smoking cessation clinics for two years 3.2% - 40% coverage amongst hypertensives 1.4% - Secondary prevention of CVD: additional 15% coverage of effective therapies 35-74 years 0.9% - 40% coverage amongst hypertensives Primary prevention of CVD in hypertensives under 75 years 0.4% - smoking reduction in clinics as at present 1.0% - Secondary prevention of CVD; 75% coverage of 35-74 years 0.5% - statin therapy 1.6% - statin therapy Primary prevention of CVD in hypertensives 75 years + 5.6% - Other (to be locally determined) including; early detection of cancer, respiratory diseases, alcohol-related diseases, infant mortality Primary prevention of CVD among hypertensives under 75 years 0.2% - statin therapy 0.2% - 20% coverage antihypertensive Universalist Targeted
 including; early detection of cancer, respiratory diseases, alcohol-related diseases, infant mortality Primary prevention of CVD among hypertensives under 75 years 0.2% - statin therapy 0.2% - 20% coverage antihypertensive Universalist Targeted")
18
Vulnerability to poor health Vulnerability Definition “Threats to the individual (environment or personal) become greater than the ability to cope with these threats (i.e. resilience)” Modifiable threats – poverty, housing, educational attainment Non modifiable threats – age, gender, ethnicity
 Modifiable threats – poverty, housing, educational attainment Non modifiable threats – age, gender, ethnicity.")
19
Vulnerability to poor health

20
Prioritisation Criteria Identify vulnerability factors in the community of interest/area Identify community/individual resilience factors Has previous work been conducted Evidence of cost effectiveness Will working with the community have impact on priorities and targets

21
Whole Systems Approach

22
Recommendations Invest in identifying people at high risk of CVD in primary care Implement all of the “high impact” changes and integrate into whole systems approach

23
Partnership Working Health Strategy to improve: health lifestyle behaviour wider health determinants (housing, environment school attainment, jobs)
")
24
Partnership Working Supporting Work Joint strategic needs assessment Data collection from – Primary care services Secondary care services Public health trend data Local Authority GIS Social Care and Health Public/patient information (will include a review of all current health improvement strategies )
")
Similar presentations


 1991-932008-10.>")