Download presentation
Presentation is loading. Please wait.

1
Population Studies

2
Population- a group of individuals of a single species inhabiting a specific area Why study populations? –Population Too high or low = unstable ecosystem –Low species diversity = unstable ecosystem Examples: Endangered Species = low population due to human impact Invasive Species = species introduced to a new ecosystem with no predators or competition allowing the population to increase rapidly

3
Examples of Invasive Species (Write the names of the two examples) European Gypsy Moth Introduced from Europe in 1869 They were imported for silk production They defoliate sections of forest Brown Marmorated Stink Bug Native to Eastern Asia 1 st found in Allentown, PA in 1998 Possibly arrived in shipping crates from Asia They feed on a variety of plants, including fruit trees, ornamental trees and shrubs, and some crops Currently found in the northeast, mid- Atlantic region and the Pacific northwest
 European Gypsy Moth Introduced from Europe in 1869 They were imported for silk production They defoliate sections of forest Brown Marmorated Stink Bug Native to Eastern Asia 1 st found in Allentown, PA in 1998 Possibly arrived in shipping crates from Asia They feed on a variety of plants, including fruit trees, ornamental trees and shrubs, and some crops Currently found in the northeast, mid- Atlantic region and the Pacific northwest")
4
What keeps populations from growing out of control? Limiting factors- A biotic or abiotic factor that a population needs as a resource. –Provide TWO or THREE Examples: Carrying capacity- the number of individuals an ecosystem can support.

5
Population Growth = When the birth rate exceeds the death rate, due to an abundance of resources.

6
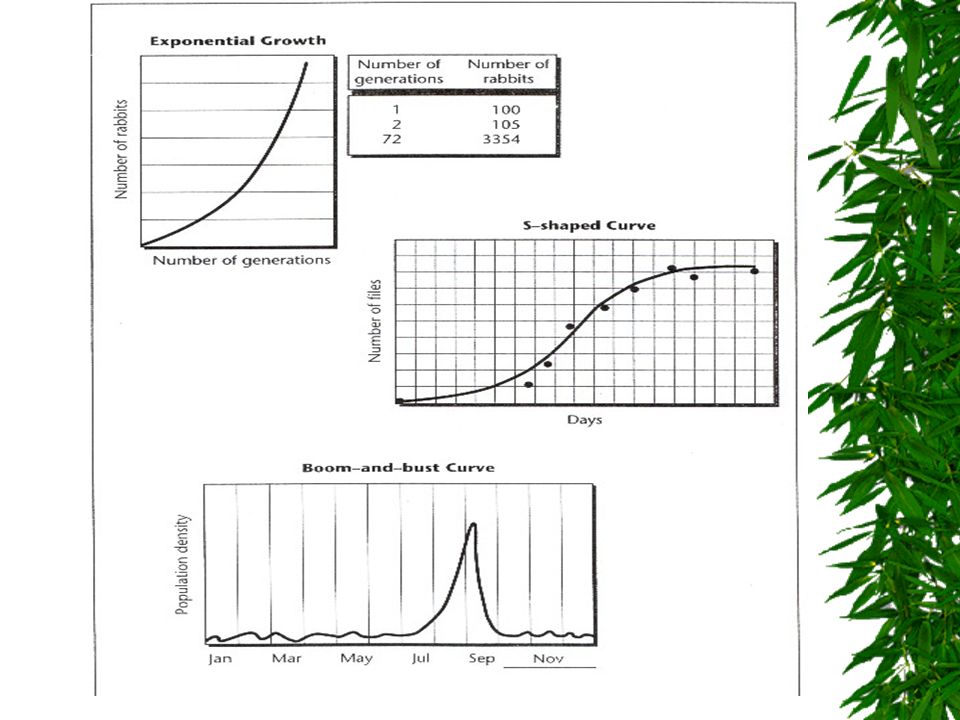
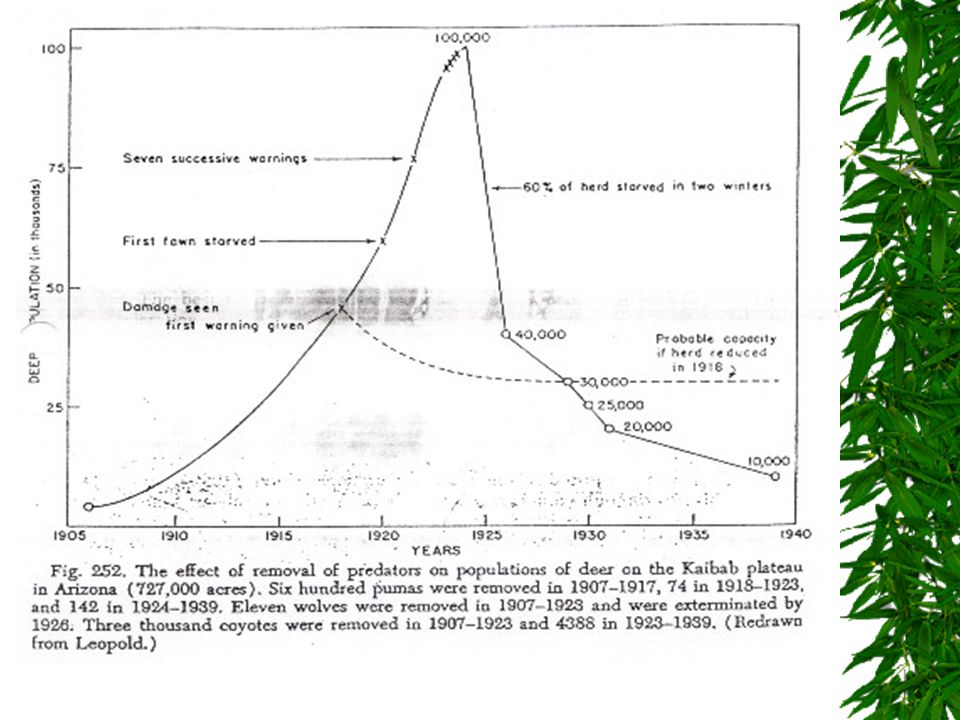
J-Curve Population Graph J curve- exponential growth of a population because of no natural predators and an abundance of resources. (Usually followed by a population crash after exceeding its carrying capacity).
..")
7
S-Curve Population Graph S curve- population increases to its carrying capacity & levels off due to predators or competition

10
Population Study Example What kind of relationship does the graph show? Which population seems to increase first before it drops? Is the hare and lynx relationship a density dependent or density independent limiting factor?

11
How do ecologists determine population? Counting- count the number in the population Mark and Recapture- ex: bird banding, tagging, microchips Random sampling- look at a part of the ecosystem and assume it is the same for the whole ecosystem

12
Which is the best method to determine each population? Trout in the Delaware River Diversity of trees in a state park Eagle eggs in a nest Deer in Bucks County Dandelions in my neighbors yard Trees on the school property

13
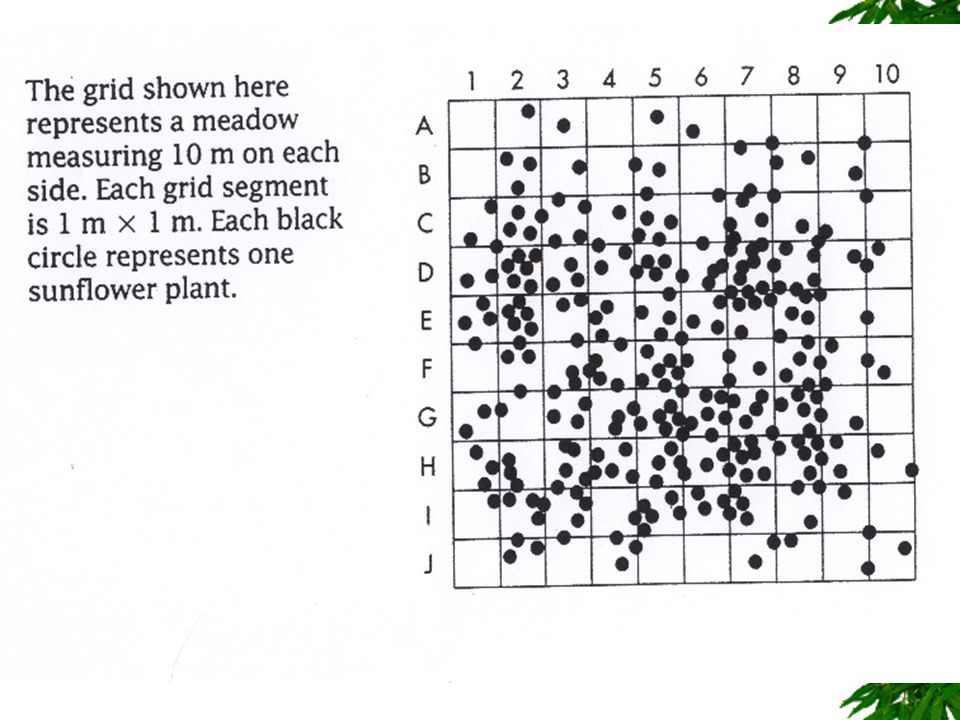
Random Sampling Method Choose letter and number combinations first A-J and 1-10 Count the number of dots in each letter and number combination square that you chose and place the numbers in the chart When finished, add up these numbers for the total in the sample Find the estimated total and then find the actual total How well did this method work?

15
Table Set-up for Random Sampling Letter/Number Combination # of sunflower plants Ex: G34 Total # of sunflowers in 10 squares Estimated Total # of sunflowers in meadow= (Total/10) x 100 Count actual # of sunflowers in meadow
 x 100 Count actual # of sunflowers in meadow")
16
Mark & Recapture Method Plug your numbers into the following equation for each trial. Solve for P. P = A (B/R) P = estimated population A = # caught and marked the first time B = # caught the second time R = # caught 2 nd time which were marked
 P = estimated population A = # caught and marked the first time B = # caught the second time R = # caught 2 nd time which were marked.")
17
Mark and Recapture Choose a color Count how many beads in your bowl are your color then release them back into the bowl. This number=A A = # caught & marked during the first catch Grab a small cup full and count the total number of beads in your hand. This number = B B = # caught during the 2 nd catch) Count how many are your color in your hand. This number = R R = # caught during 2 nd catch that were already marked (If Time) Repeat this method for 5 trials an record results
 Count how many are your color in your hand. This number = R R = # caught during 2 nd catch that were already marked (If Time) Repeat this method for 5 trials an record results.")
18
Table for Mark & Recapture Method Trial 1Trial 2Trial 3Trial 4Trial 5 A B R P= A(B/R)
")
Similar presentations


 (yes, it counts as a grade)>")
