Download presentation
Presentation is loading. Please wait.

1
Journal Club 埼玉医科大学 総合医療センター 内分泌・糖尿病内科 Department of Endocrinology and Diabetes, Saitama Medical Center, Saitama Medical University 松田 昌文 Matsuda, Masafumi 2016 年 9 月 1 日 8:30-8:55 8階 医局 Margulies KB, Hernandez AF, Redfield MM, Givertz MM, Oliveira GH, Cole R, Mann DL, Whellan DJ, Kiernan MS, Felker GM, McNulty SE, Anstrom KJ, Shah MR, Braunwald E, Cappola TP; NHLBI Heart Failure Clinical Research Network. Effects of Liraglutide on Clinical Stability Among Patients With Advanced Heart Failure and Reduced Ejection Fraction: A Randomized Clinical Trial. JAMA. 2016 Aug 2;316(5):500-8. doi: 10.1001/jama.2016.10260. Leasher JL, Bourne RR, Flaxman SR, Jonas JB, Keeffe J, Naidoo K, Pesudovs K, Price H, White RA, Wong TY, Resnikoff S, Taylor HR; Vision Loss Expert Group of the Global Burden of Disease Study. Global Estimates on the Number of People Blind or Visually Impaired by Diabetic Retinopathy: A Meta-analysis From 1990 to 2010. Diabetes Care. 2016 Sep;39(9):1643-9. doi: 10.2337/dc15-2171. Review.
: doi: /jama Leasher JL, Bourne RR, Flaxman SR, Jonas JB, Keeffe J, Naidoo K, Pesudovs K, Price H, White RA, Wong TY, Resnikoff S, Taylor HR; Vision Loss Expert Group of the Global Burden of Disease Study. Global Estimates on the Number of People Blind or Visually Impaired by Diabetic Retinopathy: A Meta-analysis From 1990 to Diabetes Care Sep;39(9): doi: /dc Review..")
2
Figure 1. Primary and Exploratory Outcomes. The primary composite outcome in the time-to-event analysis was the first occurrence of death from cardiovascular causes, nonfatal myocardial infarction, or nonfatal stroke. The cumulative incidences were estimated with the use of the Kaplan–Meier method, and the hazard ratios with the use of the Cox proportional-hazard regression model. The data analyses are truncated at 54 months, because less than 10% of the patients had an observation time beyond 54 months. The insets show the same data on an enlarged y axis. N Engl J Med. 2016 Jul 28;375(4):311-22.
:")
3
Figure 1. Primary and Exploratory Outcomes. The primary composite outcome in the time-to-event analysis was the first occurrence of death from cardiovascular causes, nonfatal myocardial infarction, or nonfatal stroke. The cumulative incidences were estimated with the use of the Kaplan–Meier method, and the hazard ratios with the use of the Cox proportional-hazard regression model. The data analyses are truncated at 54 months, because less than 10% of the patients had an observation time beyond 54 months. The insets show the same data on an enlarged y axis. N Engl J Med. 2016 Jul 28;375(4):311-22.
:")
4
Figure 1. Primary and Exploratory Outcomes. The primary composite outcome in the time-to-event analysis was the first occurrence of death from cardiovascular causes, nonfatal myocardial infarction, or nonfatal stroke. The cumulative incidences were estimated with the use of the Kaplan–Meier method, and the hazard ratios with the use of the Cox proportional-hazard regression model. The data analyses are truncated at 54 months, because less than 10% of the patients had an observation time beyond 54 months. The insets show the same data on an enlarged y axis. N Engl J Med. 2016 Jul 28;375(4):311-22.
:")
5
1 Perelman School of Medicine, University of Pennsylvania, Philadelphia 2 Duke Clinical Research Institute, Durham, North Carolina 3 Mayo Clinic, Rochester, Minnesota 4 Brigham and Women’s Hospital, Boston, Massachusetts 5 University Hospitals, Case Medical Center, Cleveland, Ohio 6 Emory University, Atlanta, Georgia 7 Washington University School of Medicine, St Louis, Missouri 8 Thomas Jefferson University, Philadelphia, Pennsylvania 9 Tufts University, Boston, Massachusetts 10 Duke University School of Medicine and Duke Heart Center, Durham, North Carolina 11 National Heart, Lung, and Blood Institute, Bethesda, Maryland JAMA. 2016;316(5):500-508. doi:10.1001/jama.2016.10260.
: doi: /jama")
6
Importance Abnormal cardiac metabolism contributes to the pathophysiology of advanced heart failure with reduced left ventricular ejection fraction (LVEF). Glucagon-like peptide 1 (GLP-1) agonists have shown cardioprotective effects in early clinical studies of patients with advanced heart failure, irrespective of type 2 diabetes status. Objective To test whether therapy with a GLP-1 agonist improves clinical stability following hospitalization for acute heart failure.
 agonists have shown cardioprotective effects in early clinical studies of patients with advanced heart failure, irrespective of type 2 diabetes status. Objective To test whether therapy with a GLP-1 agonist improves clinical stability following hospitalization for acute heart failure..")
7
Design, Setting, and Participants Phase 2, double-blind, placebo-controlled randomized clinical trial of patients with established heart failure and reduced LVEF who were recently hospitalized. Patients were enrolled between August 2013 and March 2015 at 24 US sites. Interventions The GLP-1 agonist liraglutide (n = 154) or placebo (n = 146) via a daily subcutaneous injection; study drug was advanced to a dosage of 1.8 mg/d during the first 30 days as tolerated and continued for 180 days. Main Outcomes and Measures The primary end point was a global rank score in which all patients, regardless of treatment assignment, were ranked across 3 hierarchical tiers: time to death, time to rehospitalization for heart failure, and time-averaged proportional change in N-terminal pro-B-type natriuretic peptide level from baseline to 180 days. Higher values indicate better health (stability). Exploratory secondary outcomes included primary end point components, cardiac structure and function, 6- minute walk distance, quality of life, and combined events.
 or placebo (n = 146) via a daily subcutaneous injection; study drug was advanced to a dosage of 1.8 mg/d during the first 30 days as tolerated and continued for 180 days. Main Outcomes and Measures The primary end point was a global rank score in which all patients, regardless of treatment assignment, were ranked across 3 hierarchical tiers: time to death, time to rehospitalization for heart failure, and time-averaged proportional change in N-terminal pro-B-type natriuretic peptide level from baseline to 180 days. Higher values indicate better health (stability). Exploratory secondary outcomes included primary end point components, cardiac structure and function, 6- minute walk distance, quality of life, and combined events..")
10
Abbreviation: ED, emergency department. SI conversion factors: To calculate low-density lipoprotein, high-density lipoprotein, and total cholesterol to mmol/L, multiply by 0.0259; triglycerides to mmol/L, multiply by 0.0113. a Defined as between-group difference, adjusted for baseline value. b Ranked across 3 hierarchical tiers: time to death, time to rehospitalization for heart failure, and time-averaged proportional change in N- terminal pro-B-type natriuretic peptide level from baseline to 180days.Higher values indicate better health (range, 1 [an early death] to300[a patientwhosurvived free from rehospitalization and had an improvement in N-terminal pro-B-type natriuretic peptide level]).This non parametric analysis does not provide an informative estimate of variability. c Determined using aWilcoxon test statistic for the primary end point. d Range from 1 to 100; higher scores indicate better function. e A composite score for functional status, quality of life, and social limitation. f Derived from the physical function, symptom (frequency and severity), social function, and quality-of-life domains. g Patients with a left ventricular assist device or heart transplantation were not included. h Data are expressed as hazard ratio (95%CI).
.This non parametric analysis does not provide an informative estimate of variability. c Determined using aWilcoxon test statistic for the primary end point. d Range from 1 to 100; higher scores indicate better function. e A composite score for functional status, quality of life, and social limitation. f Derived from the physical function, symptom (frequency and severity), social function, and quality-of-life domains. g Patients with a left ventricular assist device or heart transplantation were not included. h Data are expressed as hazard ratio (95%CI)..")
11
HR indicates hazard ratio. A and B, y-axis scale in blue indicates range from 0% to 16%. The median duration of follow-up was 179 days (IQR, 157-182 days) in the liraglutide group and 178 days (IQR, 150-183 days) in the placebo group. In part C, the box plots were formed by the 25th and 75th percentiles and the line within the box is the median; the error bars indicate the 95%CIs and the data markers indicate the means. a Without missing data.
 in the liraglutide group and 178 days (IQR, days) in the placebo group. In part C, the box plots were formed by the 25th and 75th percentiles and the line within the box is the median; the error bars indicate the 95%CIs and the data markers indicate the means. a Without missing data..")
12
HR indicates hazard ratio. A and B, y-axis scale in blue indicates range from 0% to 16%. The median duration of follow-up was 179 days (IQR, 157-182 days) in the liraglutide group and 178 days (IQR, 150-183 days) in the placebo group. In part C, the box plots were formed by the 25th and 75th percentiles and the line within the box is the median; the error bars indicate the 95%CIs and the data markers indicate the means. a Without missing data.
 in the liraglutide group and 178 days (IQR, days) in the placebo group. In part C, the box plots were formed by the 25th and 75th percentiles and the line within the box is the median; the error bars indicate the 95%CIs and the data markers indicate the means. a Without missing data..")
13
HR indicates hazard ratio. A and B, y-axis scale in blue indicates range from 0% to 16%. The median duration of follow-up was 179 days (IQR, 157-182 days) in the liraglutide group and 178 days (IQR, 150-183 days) in the placebo group. In part C, the box plots were formed by the 25th and 75th percentiles and the line within the box is the median; the error bars indicate the 95%CIs and the data markers indicate the means. a Without missing data.
 in the liraglutide group and 178 days (IQR, days) in the placebo group. In part C, the box plots were formed by the 25th and 75th percentiles and the line within the box is the median; the error bars indicate the 95%CIs and the data markers indicate the means. a Without missing data..")
16
Results Among the 300 patients who were randomized (median age, 61 years [interquartile range {IQR}, 52-68 years]; 64 [21%] women; 178 [59%] with type 2 diabetes; median LVEF of 25% [IQR, 19%-33%]; median N-terminal pro-B-type natriuretic peptide level of 2049 pg/mL [IQR, 1054-4235 pg/mL]), 271 completed the study. Compared with placebo, liraglutide had no significant effect on the primary end point (mean rank of 146 for the liraglutide group vs 156 for the placebo group, P =.31). There were no significant between-group differences in the number of deaths (19 [12%] in the liraglutide group vs 16 [11%] in the placebo group; hazard ratio, 1.10 [95% CI, 0.57-2.14]; P =.78) or rehospitalizations for heart failure (63 [41%] vs 50 [34%], respectively; hazard ratio, 1.30 [95% CI, 0.89-1.88]; P =.17) or for the exploratory secondary end points. Prespecified subgroup analyses in patients with diabetes did not reveal any significant between-group differences. The number of investigator-reported hyperglycemic events was 16 (10%) in the liraglutide group vs 27 (18%) in the placebo group and hypoglycemic events were infrequent (2 [1%] vs 4 [3%], respectively).
![Results Among the 300 patients who were randomized (median age, 61 years [interquartile range {IQR}, years]; 64 [21%] women; 178 [59%] with type 2 diabetes; median LVEF of 25% [IQR, 19%-33%]; median N-terminal pro-B-type natriuretic peptide level of 2049 pg/mL [IQR, pg/mL]), 271 completed the study.](http://images.slideplayer.com/42/11461388/slides/slide_16.jpg "Compared with placebo, liraglutide had no significant effect on the primary end point (mean rank of 146 for the liraglutide group vs 156 for the placebo group, P =.31). There were no significant between-group differences in the number of deaths (19 [12%] in the liraglutide group vs 16 [11%] in the placebo group; hazard ratio, 1.10 [95% CI, ]; P =.78) or rehospitalizations for heart failure (63 [41%] vs 50 [34%], respectively; hazard ratio, 1.30 [95% CI, ]; P =.17) or for the exploratory secondary end points. Prespecified subgroup analyses in patients with diabetes did not reveal any significant between-group differences. The number of investigator-reported hyperglycemic events was 16 (10%) in the liraglutide group vs 27 (18%) in the placebo group and hypoglycemic events were infrequent (2 [1%] vs 4 [3%], respectively)..")
17
Conclusions and Relevance Among patients recently hospitalized with heart failure and reduced LVEF, the use of liraglutide did not lead to greater posthospitalization clinical stability. These findings do not support the use of liraglutide in this clinical situation. Trial Registration clinicaltrials.gov Identifier: NCT01800968

18
Message 左室駆出率低下心不全( HFrEF )で最近入院した患 者 300 例(うち 2 型糖尿病合併は 178 例)を対象に、 GLP-1 受容体作動薬リラグルチドが臨床的安定性を 改善するかを第 2 相無作為化試験で検証。プラセボ に比べ、リラグルチドの主要評価項目(死亡までの 期間、心不全による再入院までの期間、ベースライ ンから 180 日時の NT-pro-BNP 値の変化に基づくス コア)に対する有意な効果は見られなかった。 LEADER 試験でも心不全は差がなかったので、結果 は変わらないが、 LEADER 試験では心不全が低い傾 向だった。重篤な心不全患者への使用についてはリ ラグルチドの有用性は不明。 https://www.m3.com/clinical/journal/16720
で最近入院した患 者 300 例(うち 2 型糖尿病合併は 178 例)を対象に、 GLP-1 受容体作動薬リラグルチドが臨床的安定性を 改善するかを第 2 相無作為化試験で検証。プラセボ に比べ、リラグルチドの主要評価項目(死亡までの 期間、心不全による再入院までの期間、ベースライ ンから 180 日時の NT-pro-BNP 値の変化に基づくス コア)に対する有意な効果は見られなかった。 LEADER 試験でも心不全は差がなかったので、結果 は変わらないが、 LEADER 試験では心不全が低い傾 向だった。重篤な心不全患者への使用についてはリ ラグルチドの有用性は不明。")
21
JAMA. 2010 Aug 11;304(6):649-56.
:")
23
1 Nova Southeastern University, Fort Lauderdale, FL 2 Vision and Eye Research Unit, Anglia Ruskin University, Cambridge, U.K. 3 School of Computer Science and Heinz College, Carnegie Mellon University, Pittsburgh, PA 4 Department of Ophthalmology, Medical Faculty Mannheim, Heidelberg University, Mannheim, Germany 5 L V Prasad Eye Institute, Hyderabad, India 6 African Vision Research Institute, University of KwaZulu-Natal, Durban, South Africa 7 Brien Holden Vision Institute, Sydney, Australia 8 NHMRC Centre for Clinical Eye Research, Flinders University, Adelaide, Australia 9 Department of Genes and Environment, Division of Epidemiology, Norwegian Institute of Public Health, Oslo, Norway 10 Singapore Eye Research Institute, Duke-NUS Graduate Medical School, National University of Singapore, Singapore 11 Melbourne School of Population and Global Health, University of Melbourne, Australia Diabetes Care. 2016 Sep;39(9):1643-9. doi: 10.2337/dc15-2171.
: doi: /dc")
24
OBJECTIVE To estimate global and regional trends from 1990 to 2010 of the prevalence and number of persons visually impaired specifically by diabetic retinopathy (DR), as a complication of the precipitous trends in global diabetes, is fundamental for health planning purposes.
, as a complication of the precipitous trends in global diabetes, is fundamental for health planning purposes.")
25
RESEARCH DESIGN AND METHODS The meta-analysis of published population studies from 1990 to 2012 for the Global Burden of Disease Study 2010 (GBD) yielded estimated global regional trends in DR among other causes of moderate and severe vision impairment (MSVI; presenting visual acuity <6/18, ≥3/60) and blindness (presenting visual acuity <3/60).
 yielded estimated global regional trends in DR among other causes of moderate and severe vision impairment (MSVI; presenting visual acuity <6/18, ≥3/60) and blindness (presenting visual acuity <3/60).")
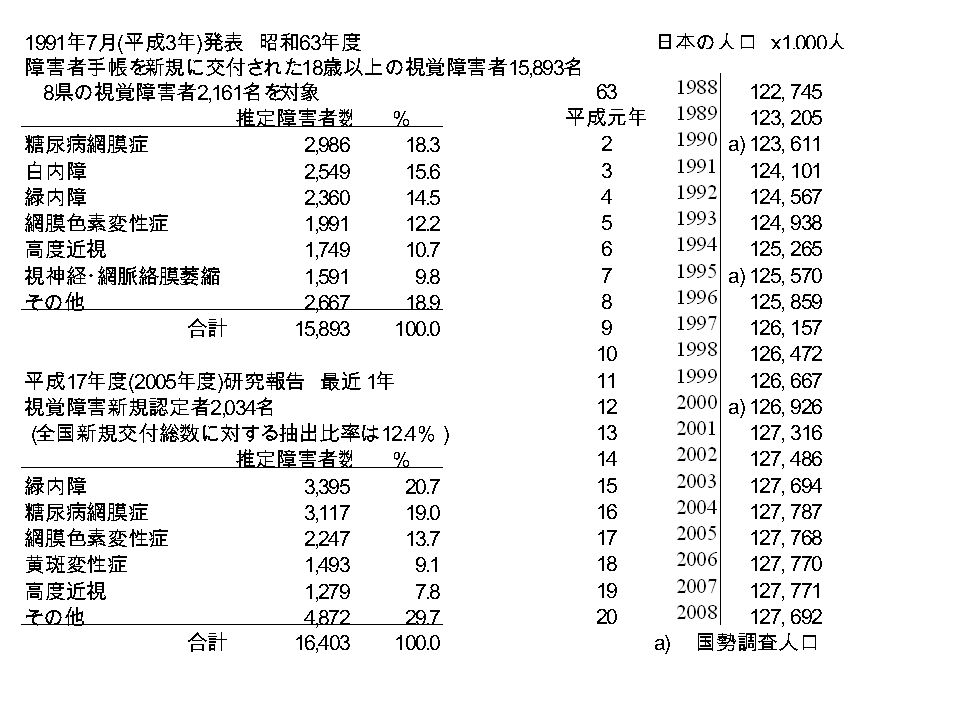
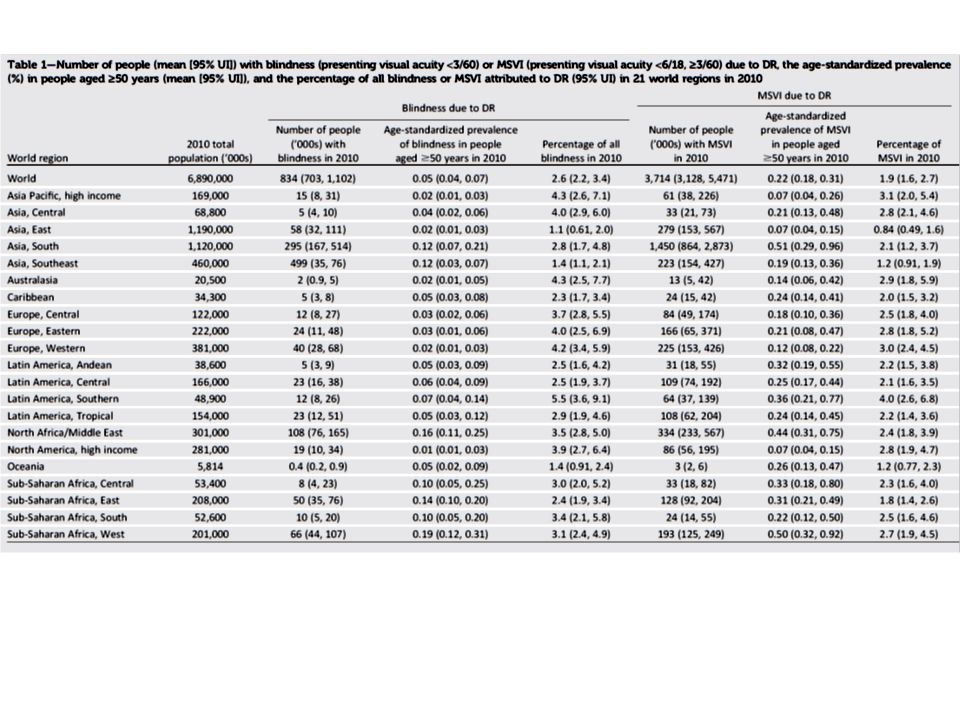
30
RESULTS Globally in 2010, out of overall 32.4 million blind and 191 million visually impaired people, 0.8 million were blind and 3.7 million were visually impaired because of DR, with an alarming increase of 27% and 64%, respectively, spanning the two decades from 1990 to 2010. DR accounted for 2.6% of all blindness in 2010 and 1.9% of all MSVI worldwide, increasing from 2.1% and 1.3%, respectively, in 1990. These figures were lower in regions with younger populations ( 4%).
..")
31
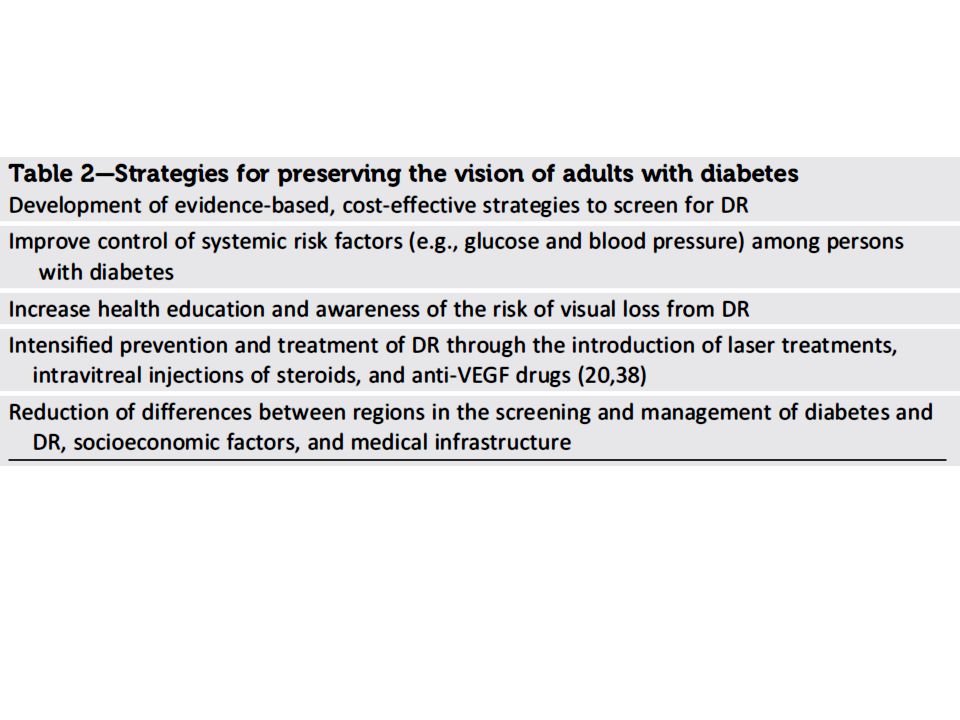
CONCLUSIONS The number of persons with visual impairment due to DR worldwide is rising and represents an increasing proportion of all blindness/MSVI causes. Age-standardized prevalence of DR- related blindness/MSVI was higher in sub- Saharan Africa and South Asia. One out of 39 blind people had blindness due to DR, and 1 out of 52 visually impaired people had visual impairment due to DR.

32
Message 糖尿病性網膜症による失明についてのメタ解析。 失明原因からみると、網膜症からの失明は全世界 で 80 万人で全体失明(~ 4000 万人)の 2% 程度 と多くはないのだが。 日本や米国では結構 % からみると多そうなのだ が。
の 2% 程度 と多くはないのだが。 日本や米国では結構 % からみると多そうなのだ が。")
Similar presentations


 ( 独 ) 農業・食品産業技術総合研究機 構 東北農業研究センター 菅野洋光.>")


行列式の定義には、数学的な概念がいろいろ必要である。まずそれらを順に見ていく。>")


 入力データに含まれる、本来ほしくない 成分.>")
を体験したことにより興味を惹かれ るきっかけとなった。主な目的は、これ.>")


 の行列に対する行列式を、 次の行列式という。 行列 の行列式を とも表す。 行列式と行列の記号.>")