Download presentation
Presentation is loading. Please wait.

1
Eastbound and Down, Loaded Up and Truckin… We’re Gonna Do What They Say Can’t Be Done— Using Data Presented by Nick Bernice & Bryan Respass LHS Little Theater – October 11, 2010 Data

2
This Morning… Study current student data and trends Define common data terms Use data to identify student performance Use new understandings to influence instruction Data

3
Perspective Critical directional shift Critical directional shift Why me? Why now? Why me? Why now? New challenges New challenges Appropriate responses Appropriate responses

4
What is a Lexile Score? A Lexile is a standard unit for measuring the comprehensibility of text A Lexile is a standard unit for measuring the comprehensibility of text – Semantics (meaning) – Syntax (sentence structure)
 – Syntax (sentence structure).")
5
Determining Text Difficulty Semantic Difficulty Semantic Difficulty the frequency of the words in a corpus of written text Syntactic Complexity Syntactic Complexity the number of words per sentence longer sentences are more complex and require more short-term memory to process

6
Lexiles… Carefully match readers to text Carefully match readers to text A tool for differentiation A tool for differentiation Allow teachers to prepare students to work with more difficult texts Allow teachers to prepare students to work with more difficult texts

7
Determining a Student’s Lexile Range Independent Reading Range of difficulty should be... 50 Lexiles above to 100 Lexiles below Independent Reading Range of difficulty should be... 50 Lexiles above to 100 Lexiles below Instructional Reading Range of difficulty should be... 50 to 150 Lexiles above Instructional Reading Range of difficulty should be... 50 to 150 Lexiles above Frustrational Reading Anything over 200 Lexile points Frustrational Reading Anything over 200 Lexile points

8
Common Lexile Scores CD-DVD Player Instructions (1080L) Microsoft Window User Manual (1150L) GM Protection Plan (1150L) Installing Your Child Safety Seat (1170L) Federal Tax Form W-4 (1260L) Application for a student loan (1270L) Medical Insurance Benefits Pkg. (1280L) SAT (1330L) GED (1060L) USA Today (1200L) Chicago Tribune (1310L) Wall Street Journal (1320L) The Washington Post (1350L) New York Times (1380L) Source: Dr. William R. Daggett
 SAT (1330L) GED (1060L) USA Today (1200L) Chicago Tribune (1310L) Wall Street Journal (1320L) The Washington Post (1350L) New York Times (1380L) Source: Dr. William R. Daggett.")
9
Lexile Histograms What does typical data look like?

10
Lexile Histograms 5 th : 900

11
Lexile Histograms 5 th : 900, 6 th : 1000

12
Lexile Histograms 5 th : 900, 6 th : 1000, 7 th : 1100

13
Lexile Histograms 5 th : 900, 6 th : 1000, 7 th : 1100, 8 th : 1050

14
Lexile Histograms 5 th : 900, 6 th : 1000, 7 th : 1100, 8 th : 1050, 9 th : 1075

15
Lexile Histograms 5 th : 900, 6 th : 1000, 7 th : 1100, 8 th : 1050, 9 th : 1075, 10 th : 1150

16
Lexile Roster (yellow) Roster of your current student’s Lexile scores (on yellow paper – Left side)
 Roster of your current student’s Lexile scores (on yellow paper – Left side)")
17
Same analysis for all 3 histogram pages Lexile Math RIT Reading RIT Draw your own lines. More later in your groups

18
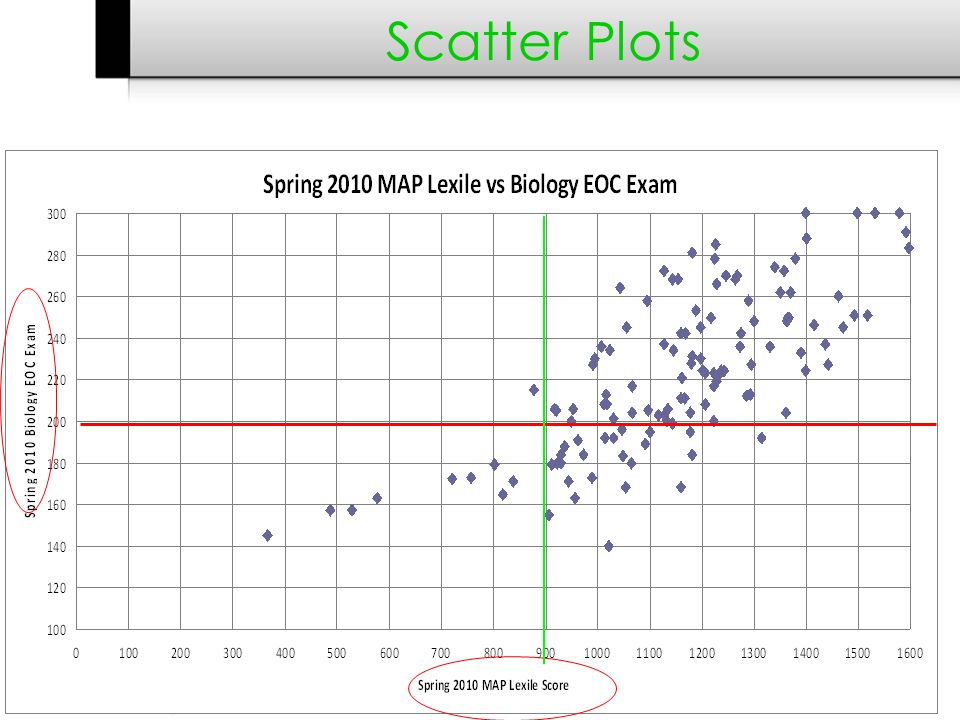
Does MAP Matter? You have scatter plot data for: – MAP Lexile v. NJASK LAL – MAP Reading v. NJASK LAL – MAP Math v. NJASK Math – MAP Math v. Algebra I EOC – MAP Reading v. Biology EOC Are MAP scores meaningful outside NWEA MAP?

19
Scatter Plots

21
NJ ASK (Right Side) Green 2009-2010 class rosters (reflective) Blue 2010 -2011 current class rosters In Language Arts Literacy, there are two distinct content clusters; Writing & Reading – Reading passages can be classified as either Working with Text or Analyzing Text. – Writing tasks can be Expository/Explanatory, Speculative, or Persuasive, depending on the grade.

22
NJ ASK In Mathematics, there are four distinct content clusters; the total points possible in each of these sums to the total number of points on the test: - Number and numerical operations - Geometry and measurement - Patterns and algebra - Data analysis, probability and discrete mathematics

23
MAP RIT Scores There are two reports on your current students in the folders: Yellow – RIT Scores (Yellow) for Reading & Writing – RIT Scores with categorical breakdowns (Purple) How do I use MAP data to help my students?
 for Reading & Writing – RIT Scores with categorical breakdowns (Purple) How do I use MAP data to help my students")
24
What is our goal with all this? Move every student forward Give students who are outliers appropriate material Leave no student behind Keep Leonia Students on the very edge of the academic blade

25
Remainder of the morning Department Discussions based on folder contents Mini-School activity – Small Schools – Case studies – Findings on big paper HS – today in hall MS – tomorrow in Faculty Lounge Data

Similar presentations


 Curt Nath Director of Curriculum Ocean City School District.>")


