Download presentation
Presentation is loading. Please wait.

1
Ch 9

2
Describe the four key macroeconomic markets Examine the relationship between the general price level and the amount of goods and services demanded. Examine the relationship between the general price level and the amount of goods and services supplied in the short-run and long- run.

3
Read before class Bring PowerPoints to class Take notes Find a study buddy Visit office hours

4
Circular flow diagram Four key markets ◦ Goods and services ◦ Resources ◦ Loanable funds ◦ Foreign exchange Four new supply and demand markets ◦ what’s measured on each axis ◦ why curves have their slope (Not yet thinking about shifts this chapter)
")
5
Fiscal Policy ◦ Changing taxes or government spending with the purpose of achieving macroeconomic goals ◦ Conducted by Congress and the President

6
Monetary Policy ◦ Changing the money supply with the purpose of achieving macroeconomic goals ◦ Conducted by the Federal Reserve System (The Fed)
")
7
MarketDemandSupplyPrice (Final) Goods and Services HouseholdsBusinessesPrice Level ResourcesBusinessesHouseholdsWage Loanable FundsBorrowersSaversInterest Rate Foreign ExchangeAmericansForeignersExchange Rate
 Goods and Services HouseholdsBusinessesPrice Level ResourcesBusinessesHouseholdsWage Loanable FundsBorrowersSaversInterest Rate Foreign ExchangeAmericansForeignersExchange Rate")
9
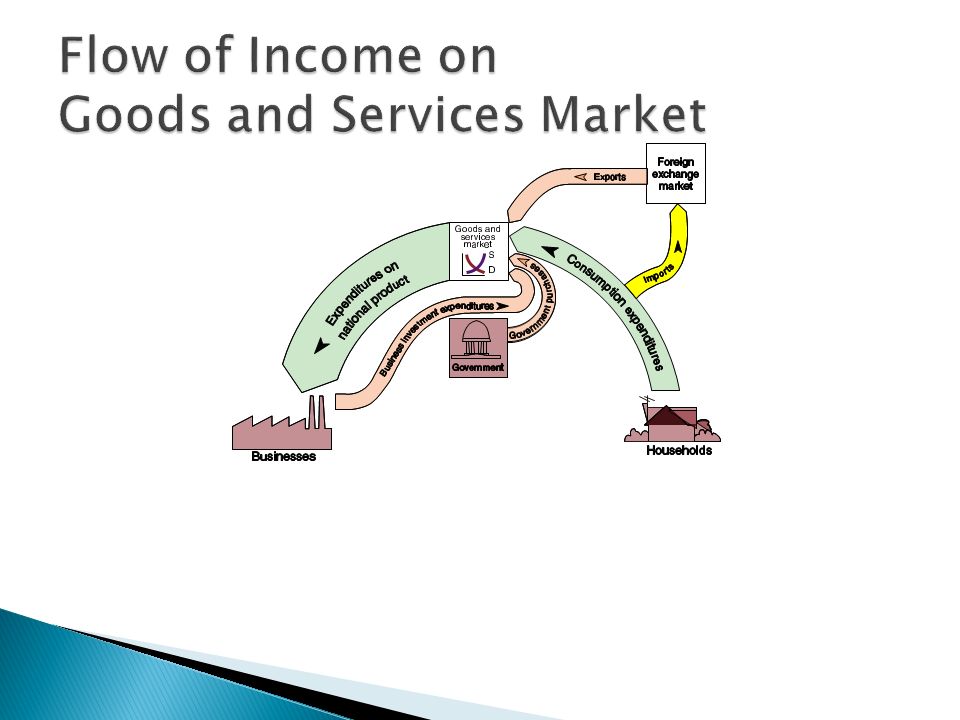
Flow of all domestically produced final-user goods and services

11
Market encompassing the flow of all final-user goods and services produced within a country during a specific time period, usually a year Hey, that’s the definition of GDP!

12
Demand (expenditures)SupplyPrice Quantity Households Businesses Governments Foreigners (net exports) BusinessesPrice Level Real GDP
SupplyPrice Quantity Households Businesses Governments Foreigners (net exports) BusinessesPrice Level Real GDP")
13
Aggregate Demand Curve – shows the relationship between the price level and the quantity of domestically produced goods and services that all households, businesses, governments, and foreigners are willing to purchase

14
Price Level P2P2 AD P1P1 Y1Y1 Y2Y2 Increase in price level will decrease the quantity of goods and services demanded. Output (real GDP)
.")
15
1. A higher price level will decrease the purchasing power of money Example: Imagine you have $500 for the month’s expenses and prices suddenly are 2X as high

16
2. A higher price level will increase the demand for money and raise the real interest rate, which will reduce additional purchases People take money out of their interest- bearing assets to pay for everyday spending; Borrowing becomes more expensive

17
3. A higher price level will make domestically produced goods more expensive, ceteris paribus Imports will increase (foreign goods cheaper); Exports will fall; overall decrease in NX
; Exports will fall; overall decrease in NX.")
18
Aggregate Supply Curve – shows the relationship between the price level and the quantity of domestically produced goods and services that businesses are willing to sell Short-run: upward sloping Long-run: vertical

19
Price Level P2P2 SRAS P1P1 Y2Y2 Y1Y1 Increase in price level will increase quantity supplied in the short run Output

20
SRAS – in the short run, an unanticipated increase in the price level will increase the profitability of businesses ***This is because resource prices are fixed in the short run!!

21
The SRAS curve assumes that resource (input) prices are “sticky” and slow to adjust. No change in input prices But final goods sell for more

22
Price Level P2P2 LRAS P1P1 YFYF Increase in price level will have no impact on quantity supplied in the long run Output (real GDP)
")
23
The LRAS curve is vertical because once people have enough time to adjust contracts, the price level will not impact output. The price of coffee doesn’t actually impact our ability to produce more or less of it in the long run

24
Price Level AD PePe YeYe SRAS Buyers are willing to purchase all the units that sellers are willing to supply at the current price level Output (real GDP)
")
25
Price Level AD 100 P 100 YFYF SRAS 100 1. Buyers are willing to purchase all the units that sellers are willing to supply at the current price level LRAS Output (real GDP)
.")
26
Price Level AD 100 P 100 YFYF SRAS 100 3. The anticipated price level is the actual price level LRAS 2. The economy is at full employment Output (real GDP)
.")
27
Full employment ◦ No cyclical unemployment ◦ Actual unemployment rate = natural rate of unemployment ◦ Actual output = potential output No boom! No bust!

28
Happens when predictions about price level are incorrect Leads to Booms/Busts Output can be higher or lower than potential Employment can be higher or lower than full

29
Actual price level is higher than predicted Short run: ◦ resource costs are low, output prices are high ◦ producers earn higher than normal profits Long run: ◦ contracts are renegotiated, resource prices rise ◦ profits return to normal levels

30
Actual price level is lower than predicted Short run: ◦ resource costs are high, output prices are low ◦ producers earn lower than normal profits Long run: ◦ contracts are renegotiated, resource prices fall ◦ profits return to normal levels

31
Resource prices (wages, inputs) fixed in the short run Measured on x-axis ◦ Output, real GDP ◦ This moves inversely with unemployment
 fixed in the short run Measured on x-axis ◦ Output, real GDP ◦ This moves inversely with unemployment")
32
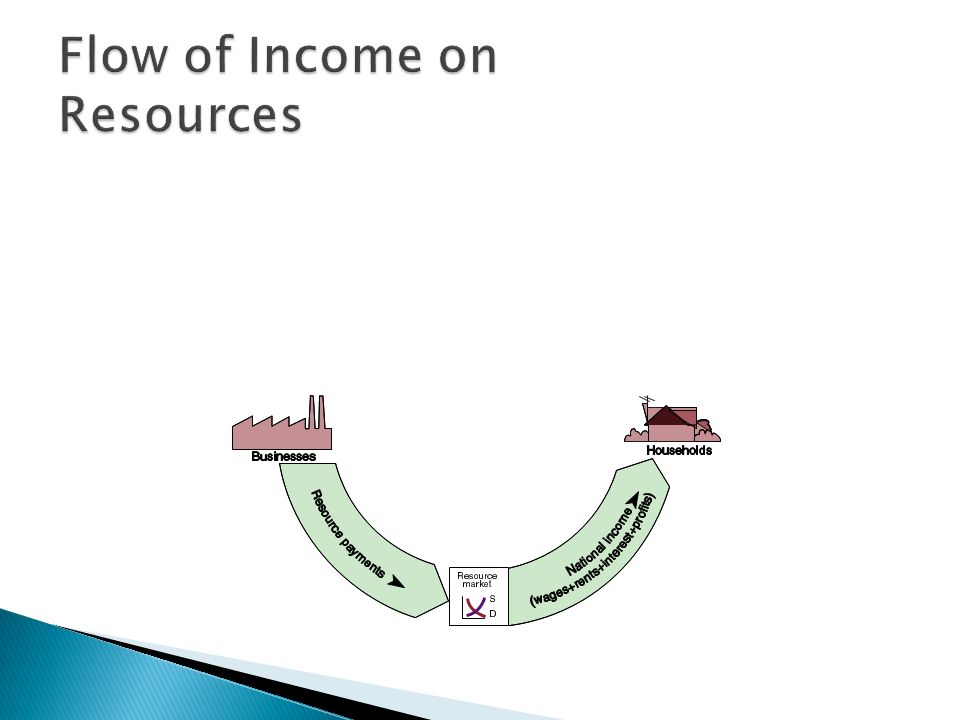
Flow of “ingredients” like labor services, raw materials, machines, and other factors of production

34
Labor makes up 70% of production costs in U.S. DemandSupplyPriceQuantity BusinessesHouseholdsWageEmployment

35
Real Resource Price (Wage) D PrPr Q S Employment Businesses demand labor and other resources Households supply labor and other resources
 D PrPr Q S Employment Businesses demand labor and other resources Households supply labor and other resources")
36
Supply: positively sloped ◦ Higher resources prices (wage) give households greater incentive to work for firms Demand: negatively sloped ◦ Higher resource prices (wage) increase the cost of production and make it less profitable
 give households greater incentive to work for firms Demand: negatively sloped ◦ Higher resource prices (wage) increase the cost of production and make it less profitable")
37
The flow of borrowing and lending

39
MarketDemandSupplyPrice Loanable Funds Borrowing by Domestic Businesses Government Saving (Lending) by Domestic Households Net Capital Inflow Interest Rate Net capital inflow (of foreign capital); ◦ Saving (lending) by foreigners in U.S. institutions Net capital outflow (of foreign capital); ◦ Borrowing by foreigners from U.S. institutions
; ◦ Borrowing by foreigners from U.S. institutions.")
40
Real Interest Rate D r1r1 Q1Q1 S Loanable Funds Borrowers demand loanable funds Lenders (savers) supply loanable funds
 supply loanable funds")
41
Supply: positively sloped ◦ Higher interest rates give an incentive to save (lend) money Demand: negatively sloped ◦ Higher interest rates reduce the quantity of loanable funds demanded (borrowing)
 money Demand: negatively sloped ◦ Higher interest rates reduce the quantity of loanable funds demanded (borrowing)")
42
Money interest rate – percentage of the amount borrowed that must be paid to the lender in addition to the repayment of the principle; nominal interest rate Real interest rate – the interest rate adjusted for expected inflation, indicates change in purchasing power Inflationary premium – the expected rate of inflation

43
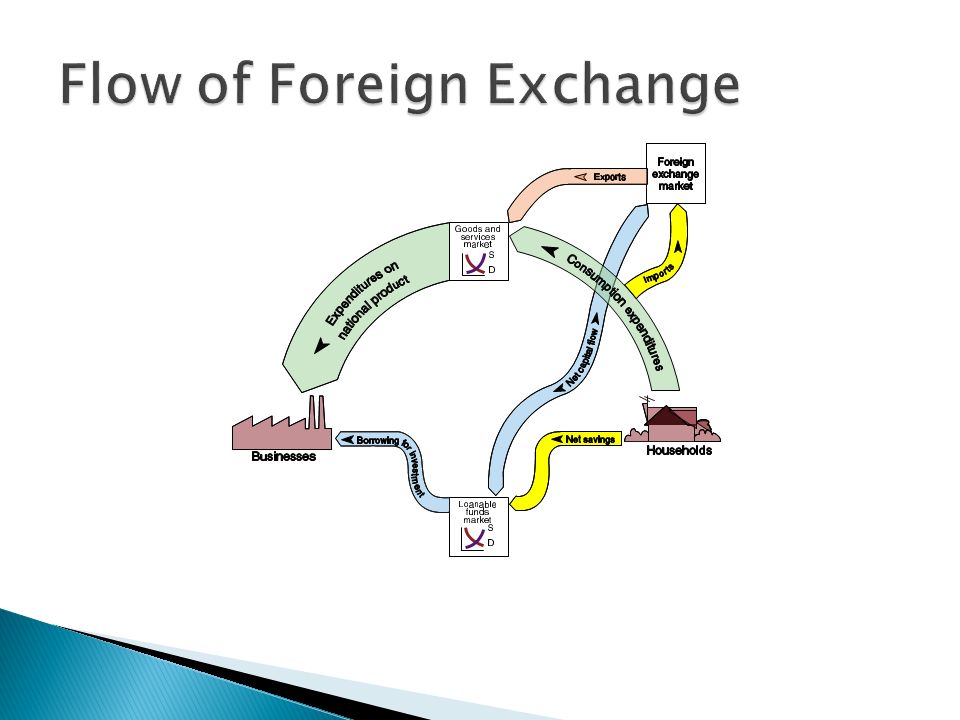
Flow of foreign currency

45
Americans (use their dollars to) demand foreign currencies Foreigners supply foreign currencies (to be exchanged into dollars) MarketDemandSupplyPrice Foreign ExchangeAmericansForeignersExchange Rate
 demand foreign currencies Foreigners supply foreign currencies (to be exchanged into dollars) MarketDemandSupplyPrice Foreign ExchangeAmericansForeignersExchange Rate")
46
Dollar Price of Foreign Currency P1P1 Q1Q1 S (Exports + Capital inflows) Quantity Foreign Currency D (Imports + Capital outflows)
 Quantity Foreign Currency D (Imports + Capital outflows)")
47
Supply: positively sloped ◦ As the dollar price of foreign currency rises, foreign currency becomes more valuable ◦ Foreigners want to supply more of their currency to be used to buy U.S. goods which have become cheaper ◦ U.S. exports rise Demand: negatively sloped ◦ As the dollar price of foreign currency rises, the dollar becomes less valuable ◦ Domestic residents demand a smaller quantity of foreign currency to buy foreign goods which have become more expensive ◦ U.S. imports fall

48
Appreciation – an increase in the value of a currency relative to foreign currencies, increases the purchasing power (move down the vertical axis when dollar appreciates) Depreciation – a decrease in the value of a currency relative to foreign currencies, decreases the purchasing power (move up the vertical axis when dollar depreciates)
 Depreciation – a decrease in the value of a currency relative to foreign currencies, decreases the purchasing power (move up the vertical axis when dollar depreciates)")
50
Trade Deficit ◦ Imports > Exports ◦ Net Capital Inflow Trade Surplus ◦ Exports > Imports ◦ Net Capital Outflow

51
Not necessarily “bad” Causes ◦ High interest rates Federal government budget deficits Good investment opportunities domestically ◦ Currency manipulation?? Foreign country’s gov’t increases supply of foreign currency by purchasing U.S. financial assets Causes U.S. currency to appreciate

52
Describe the four key macroeconomic markets Examine the relationship between the general price level and the amount of goods and services demanded. Examine the relationship between the general price level and the amount of goods and services supplied in the short-run and long- run.

Similar presentations


>")


