Download presentation
Presentation is loading. Please wait.

1
Determining AYP What’s New Step-by-Step Guide September 29, 2004

2
AYP: What’s new? AYP Determinations for 03-04 Denominator For AYP Alternate Standards Definition of Economic Disadvantage Counting ELL student test scores Identification Report Card Revisions

3
AYP Determinations for 03-04 Same targets (achievement targets in 04- 05 will be 50% in ELA and 49% in Math) 02-03 grad data for economically disadvantaged and ELL groups reported Attendance not lagged Writing responses in Spanish count as meeting standard for AYP for qualified students - Numbered Memo 16-2003-04
 grad data for economically disadvantaged and ELL groups reported Attendance not lagged Writing responses in Spanish count as meeting standard for AYP for qualified students - Numbered Memo")
4
New Denominator For AYP and Assessment Reports No longer answer sheets returned Enrollment as of May 1 (Participation) –Participation – ALL students enrolled –Performance - Highest score of students enrolled for FAY Spring Participation Collection on May 3 Numbered Memo 25-2003-2004
 –Participation – ALL students enrolled –Performance - Highest score of students enrolled for FAY Spring Participation Collection on May 3 Numbered Memo")
5
Alternate Standards New (Dec.) Guidance From USDoE Adopted by State Board in March for Extended Assessments and CLRAS
 Guidance From USDoE Adopted by State Board in March for Extended Assessments and CLRAS")
6
Alternate Standards No more than 1% of student tests used to determine AYP for a district may meet alternate standards. No Change in Choice of Test for Any Student (IEP process). Numbered Memo 023-2003-04
. Numbered Memo")
7
Economic Disadvantage U.S. Departments of Education and Agriculture Allow Use of Free and Reduced Lunch Status with strict confidentiality requirements Numbered Memo 143-2002-03 May 15 Collection

8
ELL Student Test Scores USEd announcement February 19th Scores of students during first year in U.S. not counted for performance Reading and writing assessments not required during first year in U.S. Transitioning students remain in LEP group for two years

9
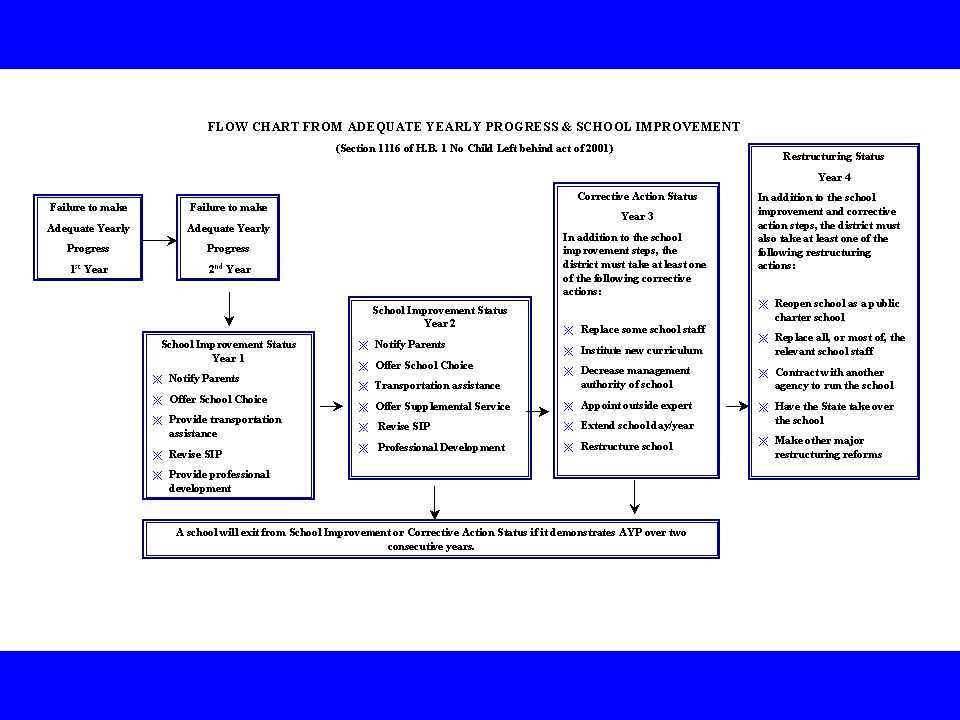
Identification for School Improvement Only Title I schools not meeting AYP for two consecutive years in an area (ELA, Math, Other Indicator) are identified for School Improvement
 are identified for School Improvement")
10
District AYP USDoE recently indicated that it would approve using grade span (elementary, middle, high) data to determine 03-04 district AYP. Districts would be identified for improvement only if they didn’t meet AYP targets in the same content area at each grade span two years in a row. ODE is investigating the feasibility of adopting this change. More information to follow.

11
Report Card Update November 10 release date No significant changes to formula Detail sheets part of data validation Display of science assessment results on detail sheets Review of report card policy and formulas through February for 04-05 and 05-06 cards

12
Data Collection 2004-05 Rolling validation Consolidated Student File Format

13
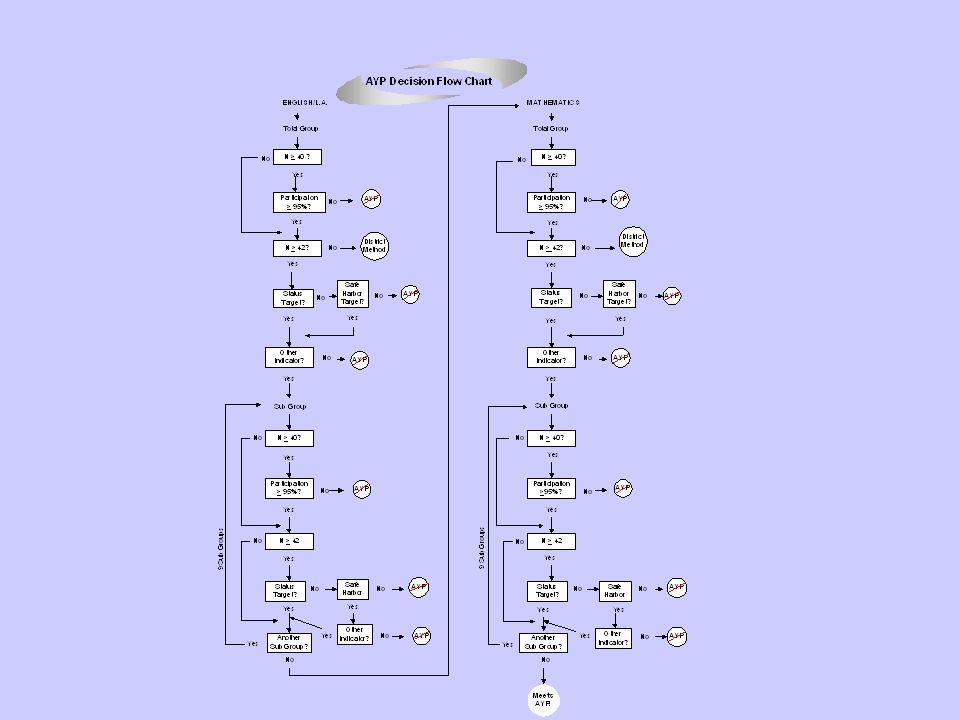
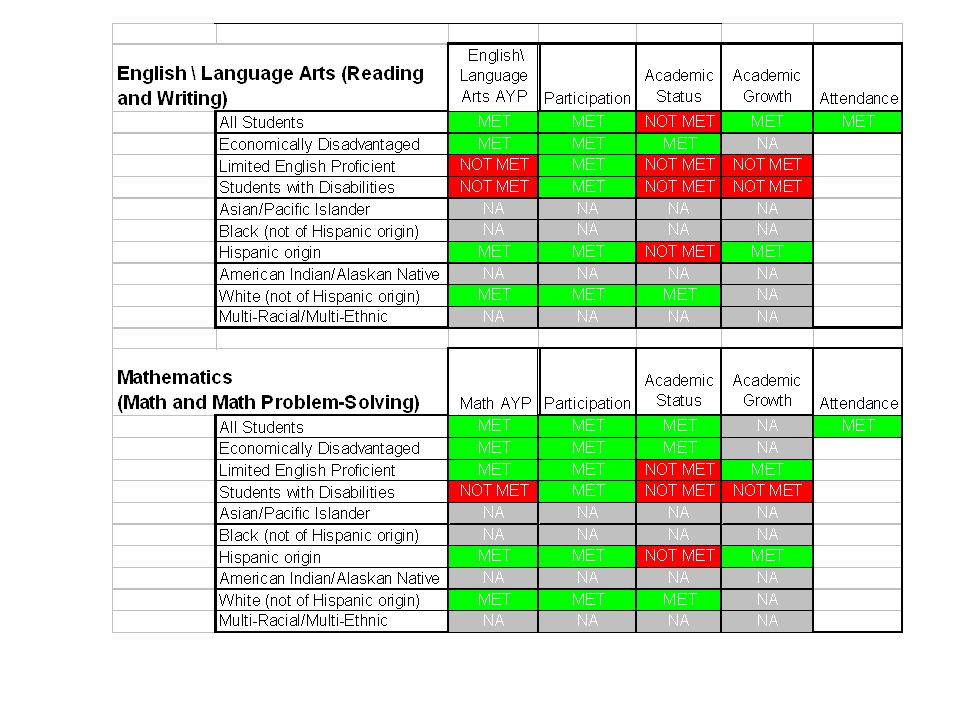
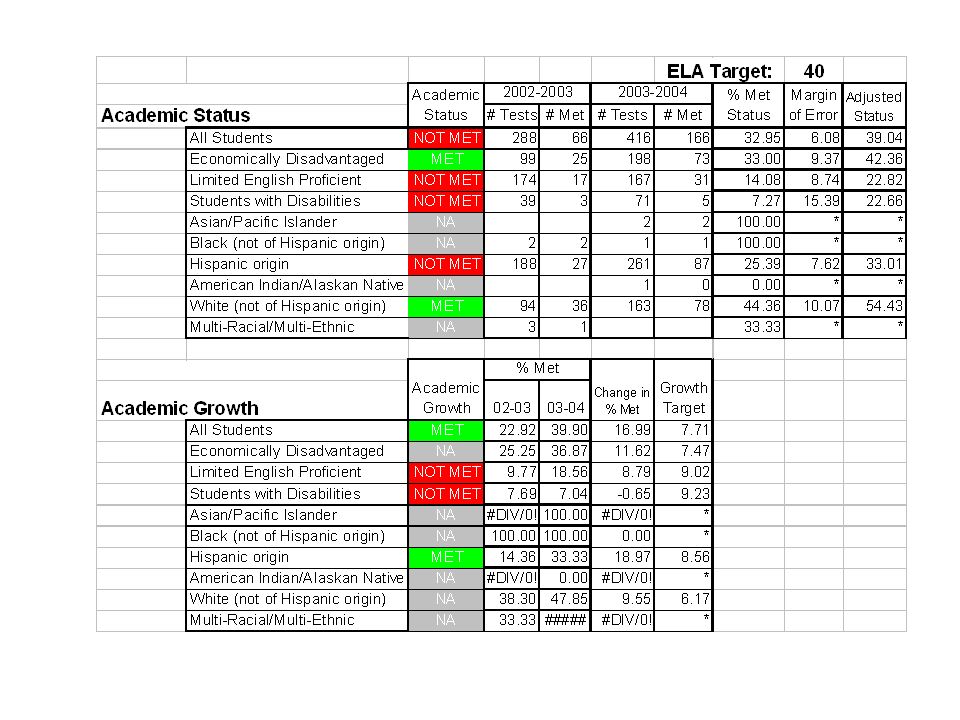
AYP Step by Step AYP “Tests” –Participation –Performance Status Safe Harbor –Other Indicator

14
AYP Tests for Each Subject and Subgroup English/Language Arts –Total –Students w/ Disabilities –Limited English Proficient –Poverty –American Indian –Asian –African American –Hispanic –White –Multi-Ethnic Mathematics –Total –Students w/ Disabilities –Limited English Proficient –Poverty –American Indian –Asian –African American –Hispanic –White –Multi-Ethnic

15
Minimum N for each “test” Participation – 40 expected tests in content area over two years Performance -- 42 tests in content area over two years (If total school population has fewer than 42 scores, additional data or methods are used to determine AYP.) Other indicator – 84 students enrolled over two years combined
 Other indicator – 84 students enrolled over two years combined")
16
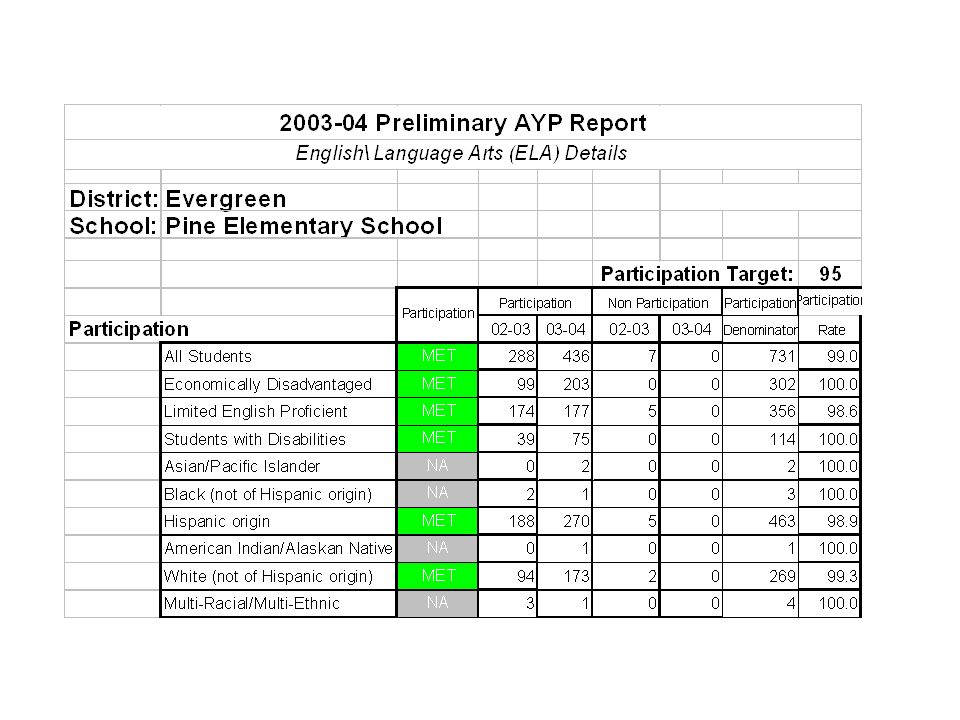
Participation 95% Criteria Participation = Number of valid test scores from all students enrolled in the school on May 3, 2004 divided by (The expected number of tests - the number of students without test scores that were not enrolled during the testing window(s) for the assessment – home schooled – district SpEd)
 for the assessment – home schooled – district SpEd)")
17
Academic Performance Criteria –ELA: 40% (50% for 04-05) –Math: 39% (49% for 04-05) Target met if achievement within margin of error. Performance = Number tests met/ number of tests from students enrolled for a full academic year –Scores from first year LEP students excluded – 10 th grade MPS results for 03-04 excluded

18
Achievement Safe Harbor Academic Growth –Reduce the percent not meeting by 10% –Example: If group’s 2003 achievement (single year of data) = 27%, the percent not meeting is 73%. The growth target is 7.3% increase or an achievement level of 34.3% in 2003. AND must meet other indicator

19
Other Indicator Graduation Rate for High Schools –Federal Formula Required in Definition –Grad rate = grad/(grad + dropouts) –Standard Diploma Only –68.1% Criterion Attendance for All Other Schools –92% Criterion 2 Years Data Used, but graduation is lagged
 –Standard Diploma Only –68.1% Criterion Attendance for All Other Schools –92% Criterion 2 Years Data Used, but graduation is lagged")
20
How AYP Tests Are Applied: N> 40 ? Yes Participation > 95%? Yes No District Method Yes Status Target? No Safe Harbor Target? No AYP Other Indicator? No AYP No AYP N> 42? Yes -

22
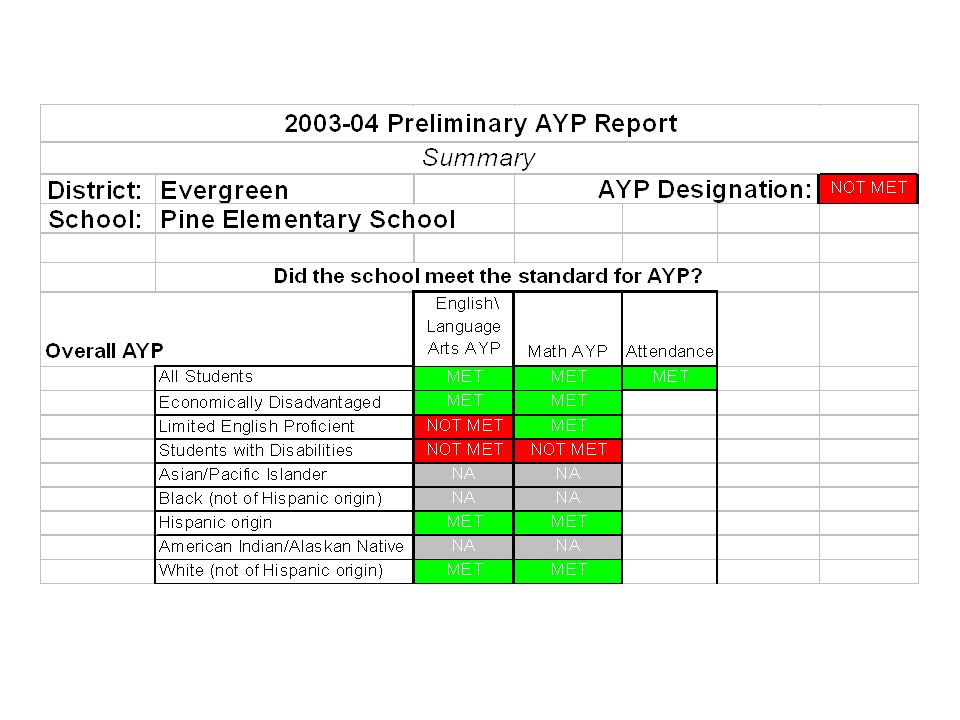
AYP: Key Points Conjunctive Model A school meets AYP only if each and every subgroup is successful in each subject. Fundamentally different from the Oregon School Report Card, which combines all data into a single, overall rating.

23
AYP: Key Points (continued) There will be significant differences in the achievement levels among schools not meeting AYP. Schools and districts will have to analyze the data to determine appropriate responses to not making AYP.

24
What Happens After Preliminary Designations? Review period – through October 14 –District corrections to collections and test records –Compliance with 1% cap –AYP Substantive appeals by districts District Preliminary AYP - October 1 target Final Designations on School and District Report Cards – November 10

29
03-04 Preliminary AYP Results 66% of schools met AYP 76% of elementary and 24% of high schools met 82% of Title I elementary and 48% of Title I high schools met 38 Title I schools are identified for school improvement 110 schools did not meet participation

30
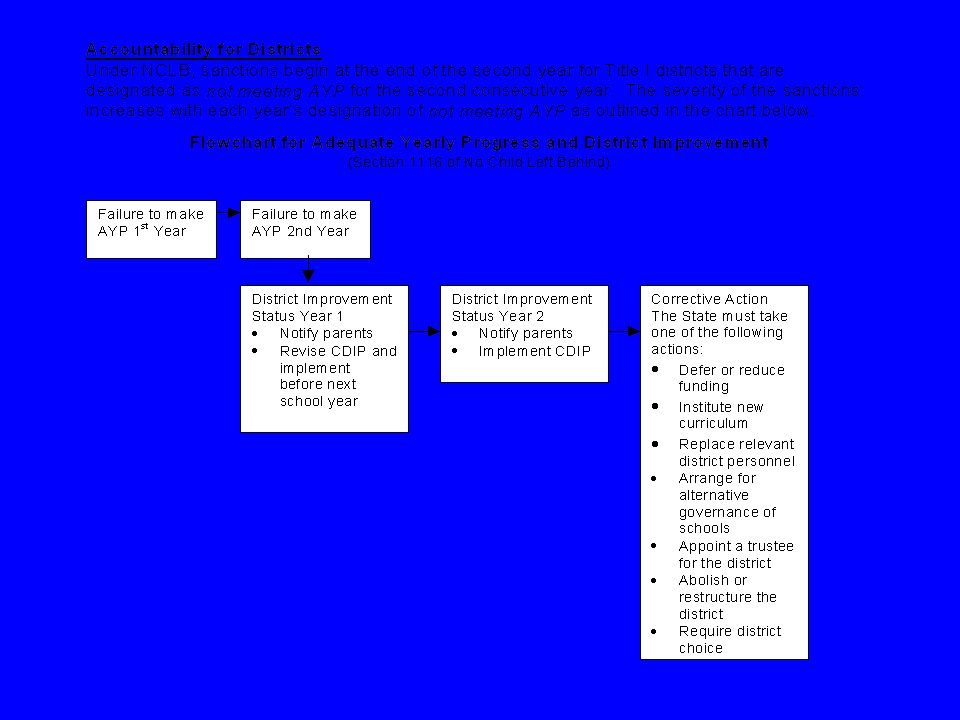
NCLB Accountability Single accountability system required Required actions for Title I schools and districts that do not make AYP in the same content area for two consecutive years Accountability for non-Title I districts – restricted use of SRSA funding and REAP-Flex

33
Accountability Revise SIP and submit to ODE – schools with “low” and “unacceptable” overall ratings on school report card Revise SIP and submit to district – schools not making AYP in the same content area for two consecutive years

34
Resources Documents, tools, guidance –www.ode.state.or.us/nclbwww.ode.state.or.us/nclb –www.ed.gov (click on policy link)www.ed.gov Contacts –AYP: jon.bridges@state.or.usjon.bridges@state.or.us –Title I requirements: chris.rhines@state.or.uschris.rhines@state.or.us
 Contacts –AYP: –Title I requirements:")
Similar presentations


 “No Child Left Behind” (2002) Adequacy Committee February 6,2008.>")


 & CAHSEE 2009-10 Results Update Prepared for the September 21, 2010 Board of Education.>")


 Board Presentation March 25, 2008.>")


 Is Determined Using 2013-14 Data The New York State Education Department November 12, 2014.>")

 Michigan Department of Education Office of Psychometrics, Accountability, Research, & Evaluation Summer.>")


