Download presentation
Presentation is loading. Please wait.

2
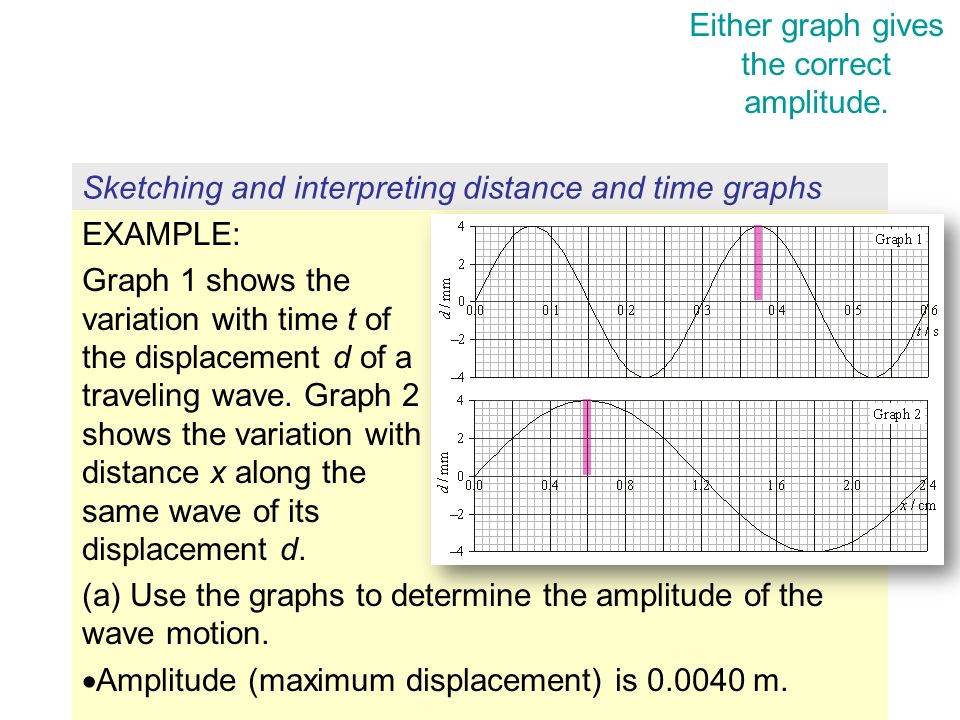
EXAMPLE: Graph 1 shows the variation with time t of the displacement d of a traveling wave. Graph 2 shows the variation with distance x along the same wave of its displacement d. (a) Use the graphs to determine the amplitude of the wave motion. Amplitude (maximum displacement) is 0.0040 m. Either graph gives the correct amplitude. Sketching and interpreting distance and time graphs
 Use the graphs to determine the amplitude of the wave motion. Amplitude (maximum displacement) is m. Either graph gives the correct amplitude. Sketching and interpreting distance and time graphs.")
3
EXAMPLE: Graph 1 shows the variation with time t of the displacement d of a traveling wave. Graph 2 shows the variation with distance x along the same wave of its displacement d. (b) Use the graphs to determine the wavelength. Wavelength is measured in metre and is the length of a complete wave. = 2.40 cm = 0.0240 m. Graph 2 must be used since its horizontal axis is in cm (not seconds as in Graph 1). Sketching and interpreting distance and time graphs
 Use the graphs to determine the wavelength. Wavelength is measured in metre and is the length of a complete wave. = 2.40 cm = m. Graph 2 must be used since its horizontal axis is in cm (not seconds as in Graph 1). Sketching and interpreting distance and time graphs.")
4
EXAMPLE: Graph 1 shows the variation with time t of the displacement d of a traveling wave. Graph 2 shows the variation with distance x along the same wave of its displacement d. (c) Use the graphs to determine the period. Period is measured in seconds and is the time for one complete wave. T = 0.30 s. Graph 1 must be used since its horizontal axis is in s (not cm as in Graph 2). Sketching and interpreting distance and time graphs
 Use the graphs to determine the period. Period is measured in seconds and is the time for one complete wave. T = 0.30 s. Graph 1 must be used since its horizontal axis is in s (not cm as in Graph 2). Sketching and interpreting distance and time graphs.")
5
EXAMPLE: Graph 1 shows the variation with time t of the displacement d of a traveling wave. Graph 2 shows the variation with distance x along the same wave of its displacement d. (d) Use the graphs to find the frequency. This can be calculated from the period T. f = 1 / T = 1 / 0.30 = 3.3 Hz. [3.333 Hz] Sketching and interpreting distance and time graphs
 Use the graphs to find the frequency. This can be calculated from the period T. f = 1 / T = 1 / 0.30 = 3.3 Hz. [3.333 Hz] Sketching and interpreting distance and time graphs.")
6
EXAMPLE: Graph 1 shows the variation with time t of the displacement d of a traveling wave. Graph 2 shows the variation with distance x along the same wave of its displacement d. (e) Use the graphs to find the wave speed. This can be calculated from and T. v = / T = 0.024 / 0.30 = 0.080 m s -1. Sketching and interpreting distance and time graphs
 Use the graphs to find the wave speed. This can be calculated from and T. v = / T = / 0.30 = m s -1. Sketching and interpreting distance and time graphs.")
7
PRACTICE: Graph 1 shows the variation with time t of the displacement y of a traveling wave. Graph 2 shows the variation with distance x along the same wave of its displacement. (a) Use the graphs to determine the amplitude and wavelength of the wave motion. Amplitude (maximum displacement) is y = 0.0020 m. Wavelength is y = 0.30 cm =.0030 m. Graph 2 must be used for since its horizontal axis is in cm. Sketching and interpreting distance and time graphs
 Use the graphs to determine the amplitude and wavelength of the wave motion. Amplitude (maximum displacement) is y = m. Wavelength is y = 0.30 cm =.0030 m. Graph 2 must be used for since its horizontal axis is in cm. Sketching and interpreting distance and time graphs.")
8
PRACTICE: Graph 1 shows the variation with time t of the displacement y of a traveling wave. Graph 2 shows the variation with distance x along the same wave of its displacement. (b) Use the graphs to determine the period and the frequency. Period (cycle time) is 0.25 ms = 0.00025 s. Frequency is f = 1 / T = 1 / 0.00025 = 4000 Hz. Graph 1 must be used for T since its horizontal axis is in ms. Sketching and interpreting distance and time graphs
 Use the graphs to determine the period and the frequency. Period (cycle time) is 0.25 ms = s. Frequency is f = 1 / T = 1 / = 4000 Hz. Graph 1 must be used for T since its horizontal axis is in ms. Sketching and interpreting distance and time graphs.")
9
PRACTICE: Graph 1 shows the variation with time t of the displacement y of a traveling wave. Graph 2 shows the variation with distance x along the same wave of its displacement. (c) Use the graphs to determine the wave speed. Wave speed is a calculation. v = / T = 0.0030 / 0.00025 = 12 m s -1. Sketching and interpreting distance and time graphs
 Use the graphs to determine the wave speed. Wave speed is a calculation. v = / T = / = 12 m s -1. Sketching and interpreting distance and time graphs.")
10
EXAMPLE: Graph 1 shows the variation with time t of the displacement x of a single particle in the medium carrying a longitudinal wave in the +x direction. (a) Use the graph to determine the period and the frequency of the particle’s motion. The period is the time for one cycle. T = 0.20 s. f = 1 / T = 1 / 0.20 = 5.0 Hz. Sketching and interpreting distance and time graphs
 Use the graph to determine the period and the frequency of the particle’s motion. The period is the time for one cycle. T = 0.20 s. f = 1 / T = 1 / 0.20 = 5.0 Hz. Sketching and interpreting distance and time graphs.")
11
EXAMPLE: Graph 2 shows the variation of the displacement x with distance d from the beginning of the wave at a particular instant in time. (b) Use the graph to determine the wavelength and wave velocity of the longitudinal wave motion. = 16.0 cm = 0.160 m. v = / T = 0.160 / 0.20 = 0.80 m s -1. Sketching and interpreting distance and time graphs
 Use the graph to determine the wavelength and wave velocity of the longitudinal wave motion. = 16.0 cm = m. v = / T = / 0.20 = 0.80 m s -1. Sketching and interpreting distance and time graphs.")
12
EXAMPLE: Graph 2 shows the variation of the displacement x with distance d from the beginning of the wave at a particular instant in time. (c) The equilibrium positions of 6 particles in the medium are shown below. Using ’s, indicate the actual position of each particle at the instant shown above. Sketching and interpreting distance and time graphs
 The equilibrium positions of 6 particles in the medium are shown below. Using ’s, indicate the actual position of each particle at the instant shown above. Sketching and interpreting distance and time graphs.")
13
EXAMPLE: Graph 2 shows the variation of the displacement x with distance d from the beginning of the wave at a particular instant in time. (d) In the diagram label the center of a compression with a C and the center of a rarefaction with an R. Sketching and interpreting distance and time graphs C R
 In the diagram label the center of a compression with a C and the center of a rarefaction with an R. Sketching and interpreting distance and time graphs C R.")
14
PRACTICE: The graph shows one complete oscillation of a particular frequency of light. (a) What is its frequency, and what part of the spectrum is it from? SOLUTION: From the graph T = 6.00 10 -16 s. Then f = 1 / T = 1 / 6.00 10 -16 s = 1.67 10 15 Hz. This is from the ultraviolet part of the spectrum. The nature of electromagnetic waves c = f relation between c, and f where c = 3.00 10 8 m s -1
 What is its frequency, and what part of the spectrum is it from. SOLUTION: From the graph T = 6.00 s. Then f = 1 / T = 1 / 6.00 s = 1.67 Hz. This is from the ultraviolet part of the spectrum. The nature of electromagnetic waves c = f relation between c, and f where c = 3.00 10 8 m s -1.")
Similar presentations


 and calculate.>")


 carrying.>")


