Download presentation
Presentation is loading. Please wait.

1
© 2007 Pearson Education Project Management

2
© 2007 Pearson Education Bechtel Group, INC. Bechtel is a $16.3 billion-a-year construction contractor that specializes in large projects. It is successful because it is able to bring large projects in quickly and on time. For each major project it organizes a project team and provides it with the supporting information systems and resources. It utilizes a web-based communications system that provides access to project information electronically. Team members have instant access to schedules, progress reports, drawings and messages.

3
© 2007 Pearson Education Projects A project is an interrelated set of activities with a definite starting and ending point, which results in a unique outcome for a specific allocation of resources. The three main goals of project management are… 1.Complete the project on time or earlier. 2.Do not exceed the budget. 3.Meet the specifications to the satisfaction of the customer.

4
© 2007 Pearson Education Project Management Project management is a systemized, phased approach to defining, organizing, planning, monitoring, and controlling projects. A collection of projects is called a program, which is an interdependent set of projects with a common strategic purpose. A cross-functional effort: Even though a project may be under the overall purview of a single department, other departments likely should be involved.

5
© 2007 Pearson Education Project Scope and Objectives Defining a project’s scope, time frame, allocated resources and objective, is essential. A Project Objective Statement provides the objectives and essence of the project. Time frame should be specific for start and ending of the project. Necessary resources are also defined, either in dollar terms or in personnel allocation.

6
© 2007 Pearson Education Project Team Selecting the right project manager is critical and specific skills are needed. Facilitator: Able to resolve conflicts, have leadership skills and a systems view. Communicator: Ability to keep senior management informed, communicate progress, and work with team members. Decision Maker: Able to organize members and make difficult decisions. Team members need to be technically competent, dedicated, and able to work well with other team members.

7
© 2007 Pearson Education Planning Projects Planning projects involves five steps: 1.Defining the work breakdown structure -- a statement of all work that has to be completed. 2.Diagramming the network -- a graphical network 3.Developing the schedule -- specifying start times for each activity 4.Analyzing cost-time trade-offs 5.Assessing risks

8
© 2007 Pearson Education Defining the Work Breakdown Structure A Work Breakdown Structure is simply a statement of all work that has to be completed. Major work components are identified and then broken down into smaller tasks by the project team. This process may involve a hierarchy of work levels. An Activity is the smallest unit of work effort consuming both the time and resources that the project manager can schedule and control. Task Ownership: Each activity must have an owner who is responsible for doing the work.

9
© 2007 Pearson Education A Work Breakdown Structure (three levels) for a new business © 2007 Pearson Education
 for a new business © 2007 Pearson Education")
10
Diagramming the Network A Network Diagram visually displays the interrelated activities using nodes (circles) and arcs (arrows) that depict the relationships between activities. Two network planning methods (PERT & CPM) were originally distinctive, but today the differences are minor and will be jointly referred to as PERT/CPM. PERT (Program Evaluation and Review Technique) was utilized when activity times involved risk. CPM (Critical Path Method) was used when activity times were certain.
 were originally distinctive, but today the differences are minor and will be jointly referred to as PERT/CPM. PERT (Program Evaluation and Review Technique) was utilized when activity times involved risk. CPM (Critical Path Method) was used when activity times were certain..")
11
© 2007 Pearson Education Network techniques Developed in 1950’s CPM by DuPont for chemical plants (1957) PERT by Booz, Allen & Hamilton with the U.S. Navy, for Polaris missile (1958) Consider precedence relationships and interdependencies Each uses a different estimate of activity times PERT and CPM
 Consider precedence relationships and interdependencies Each uses a different estimate of activity times PERT and CPM.")
12
© 2007 Pearson Education Six Steps PERT & CPM 1.Define the project and prepare the work breakdown structure 2.Develop relationships among the activities - decide which activities must precede and which must follow others 3.Draw the network connecting all of the activities

13
© 2007 Pearson Education Six Steps PERT & CPM 4.Assign time and/or cost estimates to each activity 5.Compute the longest time path through the network – this is called the critical path 6.Use the network to help plan, schedule, monitor, and control the project

14
© 2007 Pearson Education 1.When will the entire project be completed? 2.What are the critical activities or tasks in the project? 3.Which are the noncritical activities? 4.What is the probability the project will be completed by a specific date? Questions PERT & CPM Can Answer

15
© 2007 Pearson Education 5.Is the project on schedule, behind schedule, or ahead of schedule? 6.Is the money spent equal to, less than, or greater than the budget? 7.Are there enough resources available to finish the project on time? 8.If the project must be finished in a shorter time, what is the way to accomplish this at least cost? Questions PERT & CPM Can Answer

16
© 2007 Pearson Education Precedence Relationships Precedence relationships determine a sequence for undertaking activities, and specify that any given activity cannot start until a preceding activity has been completed. In the AON approach, the nodes (circles) represent activities, and the arcs represent the precedence relationships between them. AON STU Activity On Node approach “S” precedes “T” which precedes “U”
 represent activities, and the arcs represent the precedence relationships between them. AON STU Activity On Node approach S precedes T which precedes U .")
17
© 2007 Pearson Education Activity Relationships T U S T & U cannot begin until S has been completed. S T U S & T must be completed before U can be started.

18
© 2007 Pearson Education Activity Relationships S T U V U & V can’t begin until S & T have been completed. S T U V U cannot begin until S & T have been completed. V cannot begin until T has been completed.

19
© 2007 Pearson Education Activity Relationships STV U T & U cannot begin until S has been completed; V cannot begin until both T & U have been completed.

20
© 2007 Pearson Education St. Adolf’s Hospital Example 3.1 Immediate ActivityDescriptionPredecessor(s)Responsibility ASelect administrative and medical staff. BSelect site and do site survey. CSelect equipment. DPrepare final construction plans and layout. EBring utilities to the site. FInterview applicants and fill positions in nursing, support staff, maintenance, nursing, support staff, maintenance, and security. and security. GPurchase and take delivery of equipment. HConstruct the hospital. IDevelop an information system. JInstall the equipment. KTrain nurses and support staff.
Responsibility ASelect administrative and medical staff. BSelect site and do site survey. CSelect equipment. DPrepare final construction plans and layout. EBring utilities to the site. FInterview applicants and fill positions in nursing, support staff, maintenance, nursing, support staff, maintenance, and security. and security. GPurchase and take delivery of equipment. HConstruct the hospital. IDevelop an information system. JInstall the equipment. KTrain nurses and support staff..")
21
© 2007 Pearson EducationImmediate ActivityDescriptionPredecessor(s)Responsibility Time ASelect administrative and medical staff.—Johnson 12 BSelect site and do site survey.—Taylor 9 CSelect equipment.AAdams 10 DPrepare final construction plans and layout.BTaylor 10 EBring utilities to the site.BBurton 24 FInterview applicants and fill positions inAJohnson 10 nursing, support staff, maintenance, nursing, support staff, maintenance, and security. and security. GPurchase and take delivery of equipment.CAdams 35 HConstruct the hospital.DTaylor 40 IDevelop an information system.ASimmons 15 1JInstall the equipment.E,G,HAdams 4 KTrain nurses and support staff.F,I,JJohnson 6 St. Adolf’s Hospital Example 3.1

22
© 2007 Pearson Education St. Adolf’s Hospital Diagramming the Network Finish Start A B C D E FGHI J K A— B— CA DB EB FA GC HD IA JE,G,H KF,I,J Immediate Predecessor

23
© 2007 Pearson Education St. Adolf’s Hospital FinishStart A B C D E F G H I J K Path Time (wks) A-I-K33 A-F-K28 A-C-G-J-K67 B-D-H-J-K69 B-E-J-K43 Paths are the sequence of activities between a project’s start and finish.
 A-I-K33 A-F-K28 A-C-G-J-K67 B-D-H-J-K69 B-E-J-K43 Paths are the sequence of activities between a project’s start and finish..")
24
© 2007 Pearson Education St. Adolf’s Hospital FinishStart A B C D E F G H I J K Path Time (wks) A-I-K33 A-F-K28 A-C-G-J-K67 B-D-H-J-K69 B-E-J-K43 Project Expected Time is 69 wks. The critical path is the longest path!
 A-I-K33 A-F-K28 A-C-G-J-K67 B-D-H-J-K69 B-E-J-K43 Project Expected Time is 69 wks. The critical path is the longest path!.")
25
© 2007 Pearson Education Application 3.1

26
© 2007 Pearson Education Application 3.1 Solution

27
© 2007 Pearson Education The project team must make time estimates for each activity. Activity times may be risky, in which case a probability distribution can be used (CPM). For this project the times will be certain. Activity slack is the maximum length of time that an activity can be delayed without delaying the entire project. For St. Adolf’s we can’t go beyond 69 weeks. St. Adolf’s Hospital Developing the Schedule
. For this project the times will be certain. Activity slack is the maximum length of time that an activity can be delayed without delaying the entire project. For St. Adolf’s we can’t go beyond 69 weeks. St. Adolf’s Hospital Developing the Schedule.")
28
© 2007 Pearson Education Earliest Start Time (ES) is the latest finish time of the immediately preceding activities. Earliest Finish Time (EF) is an activity’s earliest start time plus its estimated duration. Latest Start Time (LS) is the latest finish time minus the activity’s estimated duration. Latest Finish Time (LF) is the earliest latest start time of the activities that immediately follow. For simplicity, all projects start at time zero. St. Adolf’s Hospital Developing the Schedule
 is an activity’s earliest start time plus its estimated duration. Latest Start Time (LS) is the latest finish time minus the activity’s estimated duration. Latest Finish Time (LF) is the earliest latest start time of the activities that immediately follow. For simplicity, all projects start at time zero. St. Adolf’s Hospital Developing the Schedule.")
29
© 2007 Pearson Education What AON Nodes look like Latest Finish Latest Start Activity Activity Duration Slack The earliest you can complete an activity -- determined by adding the activity time to the earliest start time. The latest you can finish an activity without delaying the project completion date. It is the same as the Latest Start time of the next activity. If there are two or more subsequent activities, this time is the same as the earliest of those “Latest Start” times. Determined by the earliest finish time of the precedent activity. If there are two or more precedent activities, this time is the same as precedent activity with the latest “Earliest Finish” time. This is the Latest Finish time minus the activity time. Slack is the difference, if any, between the earliest start and latest start times (or the earliest finish and latest finish times). S = LS – ES or S = LF– EF © 2007 Pearson Education Earliest Start Earliest Finish
. S = LS – ES or S = LF– EF © 2007 Pearson Education Earliest Start Earliest Finish.")
30
© 2007 Pearson Education Earliest Start and Earliest Finish Times K6K6 C 10 G 35 J4J4 H 40 B9B9 D 10 E 24 I 15 Finish Start A 12 F 10 © 2007 Pearson Education 0 Earliest start time 12 Earliest finish time 0 9 9 33 9 1919 59 22 57 12 22 59 63 12 27 12 22 63 69 Example 3.2

31
© 2007 Pearson Education Earliest Start and Earliest Finish Times © 2007 Pearson Education Critical Path The Critical Path takes 69 weeks K6K6 C 10 G 35 J4J4 H 40 B9B9 D 10 E 24 I 15 Finish Start A 12 F 10 0 9 9 33 9 1919 59 22 57 12 22 59 63 12 27 12 22 63 690 12 Example 3.2

32
© 2007 Pearson Education K6K6 C 10 G 35 J4J4 H 40 B9B9 D 10 E 24 I 15 Finish Start A 12 F 10 0 9 9 33 9 1919 59 22 57 12 22 59 63 12 27 12 22 63 690 12 Latest Start and Latest Finish Times © 2007 Pearson Education 48 63 53 63 59 63 24 59 19 59 35 59 14 24 9 19 2 14 0 9 Latest finish time 63 69 Latest start time Example 3.2

33
© 2007 Pearson Education Example 3.2

34
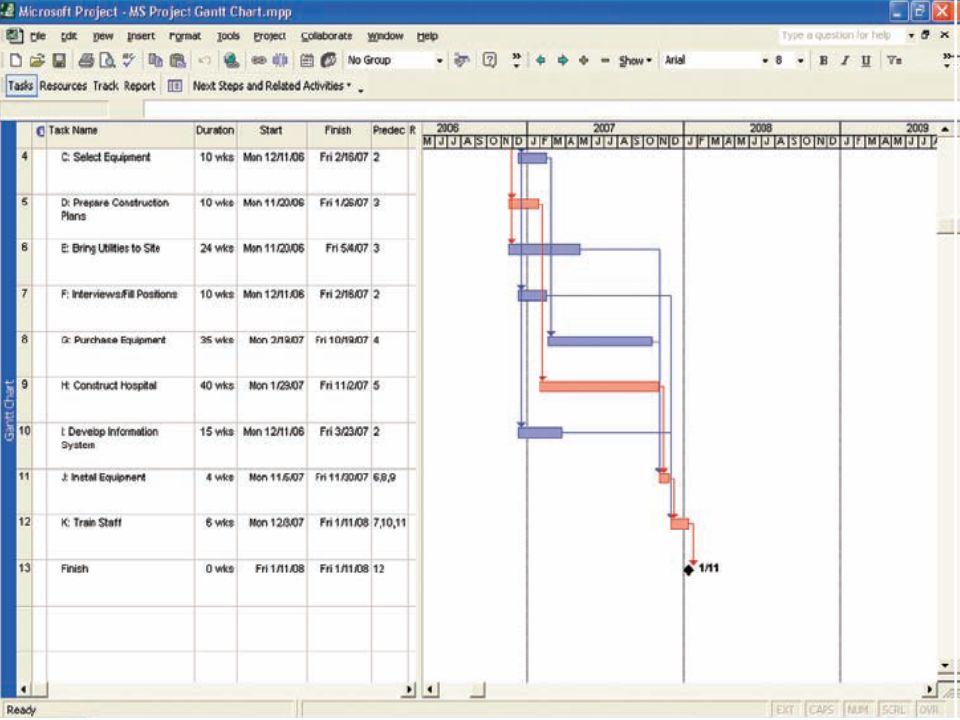
© 2007 Pearson Education Project Schedule A Gantt Chart is a project schedule, usually created by the project manager using computer software, that superimposes project activities, with their precedence relationships and estimated duration times, on a time line. Activity slack is useful because it highlights activities that need close attention. Free slack is the amount of time an activity’s earliest finish time can be delayed without delaying the earliest start time of any activity that immediately follows. Activities on the critical path have zero slack and cannot be delayed without delaying the project completion.

35
© 2007 Pearson Education

38
Activity Slack Analysis Node DurationESLS Slack A12022 B9000 C1012142 D10990 E2493526 F10125341 G3522242 H4019190 I15124836 J459590 K663630 Example 3.3

39
© 2007 Pearson Education Determining the Project Schedule Perform a Critical Path Analysis ActivityDescription Time Preceding (weeks) activity ABuild internal components2- BModify roof and floor3- CConstruct collection stack2A DPour concrete and install frame4A,B EBuild high-temperature burner4C FInstall pollution control system 3C GInstall air pollution device5D,E HInspect and test2F,G Total Time (weeks)25 Table 3.2
 activity ABuild internal components2- BModify roof and floor3- CConstruct collection stack2A DPour concrete and install frame4A,B EBuild high-temperature burner4C FInstall pollution control system 3C GInstall air pollution device5D,E HInspect and test2F,G Total Time (weeks)25 Table 3.2")
40
© 2007 Pearson Education Determining the Project Schedule Perform a Critical Path Analysis Table 3.2 ActivityDescriptionTime (weeks) ABuild internal components2 BModify roof and floor3 CConstruct collection stack2 DPour concrete and install frame4 EBuild high-temperature burner4 FInstall pollution control system 3 GInstall air pollution device5 HInspect and test2 Total Time (weeks)25 Earliest start (ES) =earliest time at which an activity can start, assuming all predecessors have been completed Earliest finish (EF) =earliest time at which an activity can be finished Latest start (LS) =latest time at which an activity can start so as to not delay the completion time of the entire project Latest finish (LF) =latest time by which an activity has to be finished so as to not delay the completion time of the entire project
 ABuild internal components2 BModify roof and floor3 CConstruct collection stack2 DPour concrete and install frame4 EBuild high-temperature burner4 FInstall pollution control system 3 GInstall air pollution device5 HInspect and test2 Total Time (weeks)25 Earliest start (ES) =earliest time at which an activity can start, assuming all predecessors have been completed Earliest finish (EF) =earliest time at which an activity can be finished Latest start (LS) =latest time at which an activity can start so as to not delay the completion time of the entire project Latest finish (LF) =latest time by which an activity has to be finished so as to not delay the completion time of the entire project")
41
© 2007 Pearson Education Determining the Project Schedule Perform a Critical Path Analysis Figure 3.10 A Activity Name or Symbol Earliest Start ES Earliest Finish EF Latest Start LS Latest Finish LF Activity Duration 2

42
© 2007 Pearson Education Forward Pass Begin at starting event and work forward Earliest Start Time Rule: If an activity has only a single immediate predecessor, its ES equals the EF of the predecessor If an activity has multiple immediate predecessors, its ES is the maximum of all the EF values of its predecessors ES = Max {EF of all immediate predecessors}

43
© 2007 Pearson Education Forward Pass Begin at starting event and work forward Earliest Finish Time Rule: The earliest finish time (EF) of an activity is the sum of its earliest start time (ES) and its activity time EF = ES + Activity time
 of an activity is the sum of its earliest start time (ES) and its activity time EF = ES + Activity time")
44
© 2007 Pearson Education ES/EF Network for Milwaukee Paper Start 0 0 ES 0 EF = ES + Activity time

45
© 2007 Pearson Education ES/EF Network for Milwaukee Paper Start 0 0 0 A2A2 2 EF of A = ES of A + 2 0 ES of A

46
© 2007 Pearson Education B3B3 ES/EF Network for Milwaukee Paper Start 0 0 0 A2A2 20 3 EF of B = ES of B + 3 0 ES of B

47
© 2007 Pearson Education C2C2 24 ES/EF Network for Milwaukee Paper B3B3 03 Start 0 0 0 A2A2 20

48
© 2007 Pearson Education C2C2 24 ES/EF Network for Milwaukee Paper B3B3 03 Start 0 0 0 A2A2 20 D4D4 7 3 = Max (2, 3)
")
49
© 2007 Pearson Education D4D4 37 C2C2 24 ES/EF Network for Milwaukee Paper B3B3 03 Start 0 0 0 A2A2 20

50
© 2007 Pearson Education E4E4 F3F3 G5G5 H2H2 481315 4 813 7 D4D4 37 C2C2 24 ES/EF Network for Milwaukee Paper B3B3 03 Start 0 0 0 A2A2 20 Figure 3.11

51
© 2007 Pearson Education Backward Pass Begin with the last event and work backwards Latest Finish Time Rule: If an activity is an immediate predecessor for just a single activity, its LF equals the LS of the activity that immediately follows it If an activity is an immediate predecessor to more than one activity, its LF is the minimum of all LS values of all activities that immediately follow it LF = Min {LS of all immediate following activities}

52
© 2007 Pearson Education Backward Pass Begin with the last event and work backwards Latest Start Time Rule: The latest start time (LS) of an activity is the difference of its latest finish time (LF) and its activity time LS = LF – Activity time
 of an activity is the difference of its latest finish time (LF) and its activity time LS = LF – Activity time")
53
© 2007 Pearson Education LS/LF Times for Milwaukee Paper E4E4 F3F3 G5G5 H2H2 481315 4 813 7 D4D4 37 C2C2 24 B3B3 03 Start 0 0 0 A2A2 20 LF = EF of Project 1513 LS = LF – Activity time

54
© 2007 Pearson Education LS/LF Times for Milwaukee Paper E4E4 F3F3 G5G5 H2H2 481315 4 813 7 15 D4D4 37 C2C2 24 B3B3 03 Start 0 0 0 A2A2 20 LF = Min(LS of following activity) 1013
 1013")
55
© 2007 Pearson Education LS/LF Times for Milwaukee Paper E4E4 F3F3 G5G5 H2H2 481315 4 813 7 15 1013 8 48 D4D4 37 C2C2 24 B3B3 03 Start 0 0 0 A2A2 20 LF = Min(4, 10) 42
 42")
56
© 2007 Pearson Education LS/LF Times for Milwaukee Paper E4E4 F3F3 G5G5 H2H2 481315 4 813 7 15 1013 8 48 D4D4 37 C2C2 24 B3B3 03 Start 0 0 0 A2A2 20 42 84 20 41 00

57
© 2007 Pearson Education Computing Slack Time After computing the ES, EF, LS, and LF times for all activities, compute the slack or free time for each activity Slack is the length of time an activity can be delayed without delaying the entire project Slack = LS – ES or Slack = LF – EF

58
© 2007 Pearson Education Computing Slack Time EarliestEarliestLatestLatestOn StartFinishStartFinishSlackCritical ActivityESEFLSLFLS – ESPath A02020Yes B03141No C24240Yes D37481No E48480Yes F4710136No G8138130Yes H131513150Yes Table 3.3

59
© 2007 Pearson Education Critical Path for Milwaukee Paper E4E4 F3F3 G5G5 H2H2 481315 4 813 7 15 1013 8 48 D4D4 37 C2C2 24 B3B3 03 Start 0 0 0 A2A2 20 42 84 20 41 00

60
© 2007 Pearson Education ES – EF Gantt Chart for Milwaukee Paper ABuild internal components BModify roof and floor CConstruct collection stack DPour concrete and install frame EBuild high- temperature burner FInstall pollution control system GInstall air pollution device HInspect and test 12345678910111213141516

61
© 2007 Pearson Education LS – LF Gantt Chart for Milwaukee Paper ABuild internal components BModify roof and floor CConstruct collection stack DPour concrete and install frame EBuild high- temperature burner FInstall pollution control system GInstall air pollution device HInspect and test 12345678910111213141516

62
© 2007 Pearson Education CPM assumes we know a fixed time estimate for each activity and there is no variability in activity times PERT uses a probability distribution for activity times to allow for variability Variability in Activity Times

63
© 2007 Pearson Education Application 3.2

64
© 2007 Pearson Education Application 3.2 Critical Path and Project Duration

Similar presentations


. 3 - 2 Outline Recap CPM (continued) Assign time estimates to each activity Compute the longest time path through the network.>")


