Download presentation
Presentation is loading. Please wait.

1
Pigment Analysis by HPLC at Horn Point Laboratory Laurie Van Heukelem Crystal Thomas Meg Maddox University of Maryland Center for Environmental Science Cambridge, MD, USA

2
Is that 3625 or 3826?? Pencil?! Who uses pencil? Emerging from the -25°C freezer

3
Analysis procedures

4
Sample Chromatogram

5
Sample processing: As of 10/30/06: 15% of samples analyzed 17% of time elapsed

6
Scheduling G. Fargion notifies PI for shipment date G. Fargion notifies PI for shipment date Samples to be completed by December: Samples to be completed by December: Received HPLC analyzed Data processed Datareported Chekalyuk26donedonedone Mannino356donedonedone Siegel195donedonedone Mitchell354227194 Nelson41 Hill296 Subramaniam300 Total1,568

7
Topics of Discussion Quality Assurance at HPL Quality Assurance at HPL Data reports from HPL Data reports from HPL

8
Quality Assurance at HPL 1. Method validation 2. Accuracy in Round-Robins 3. Continuous quality assessment

9
Method Validation Peak symmetry Peak symmetry Resolution between peaks Resolution between peaks Quantitation in the presence of interferences Quantitation in the presence of interferences Linear dynamic range Linear dynamic range LOD and LOQ LOD and LOQ Accuracy and precision Accuracy and precision Spiked recovery Spiked recovery

10
Accuracy in Round-Robins SIMBIOS, SeaHARRE-1, -2, -3, and -4 SIMBIOS, SeaHARRE-1, -2, -3, and -4 Reference values for natural samples are based on average consensus concentrations Reference values for natural samples are based on average consensus concentrations Accuracy is calculated as the % difference from the reference value Accuracy is calculated as the % difference from the reference value Reference values should be determined from results of quality-assured laboratories Reference values should be determined from results of quality-assured laboratories

11
Calibration accuracy in Round-Robins Average laboratory accuracy with standards Round-RobinHPLRange (7 labs) Overall average SeaHARRE-21% 1 to 18% 7% HPL-DHI (Spectrophotometric) 2%---- HPL-DHI (HPLC) 2%----
 Overall average SeaHARRE-21% 1 to 18% 7% HPL-DHI (Spectrophotometric) 2%---- HPL-DHI (HPLC) 2%----")
12
Continuous HPLC Quality Assessment at HPL Establish standardized procedures that limit uncertainties and blunders Establish standardized procedures that limit uncertainties and blunders Perform Quality Control measurements during the analysis of samples Perform Quality Control measurements during the analysis of samples Identify the range within which QC measurements should fall Identify the range within which QC measurements should fall Take corrective action if QC measurement falls outside of expected ranges Take corrective action if QC measurement falls outside of expected ranges

13
The calculation equations

14
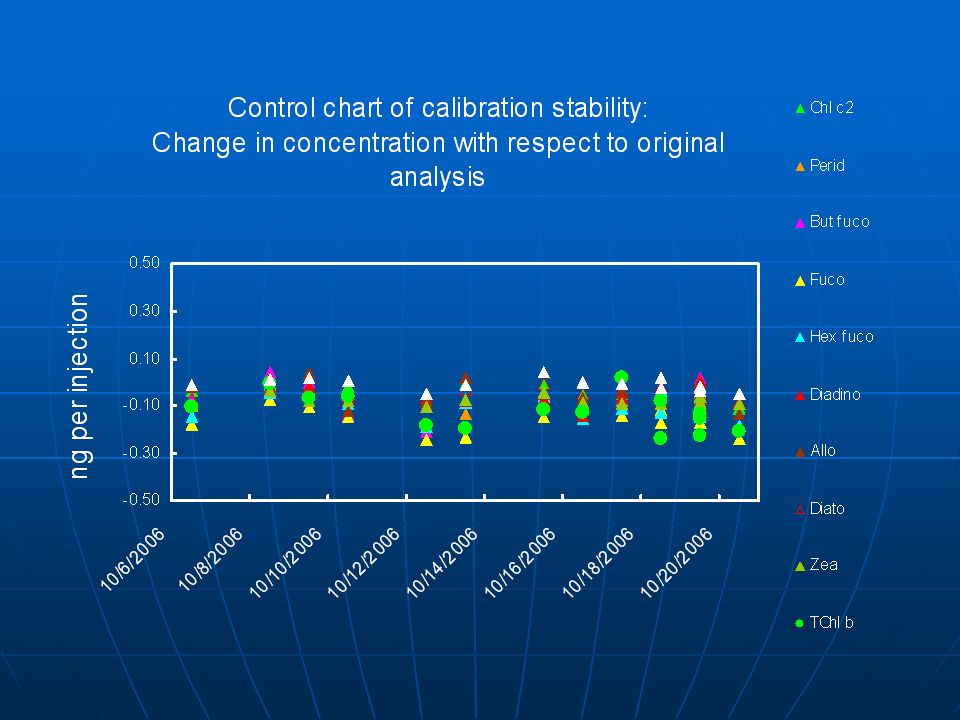
Control chart

16
Blue felt pen

17
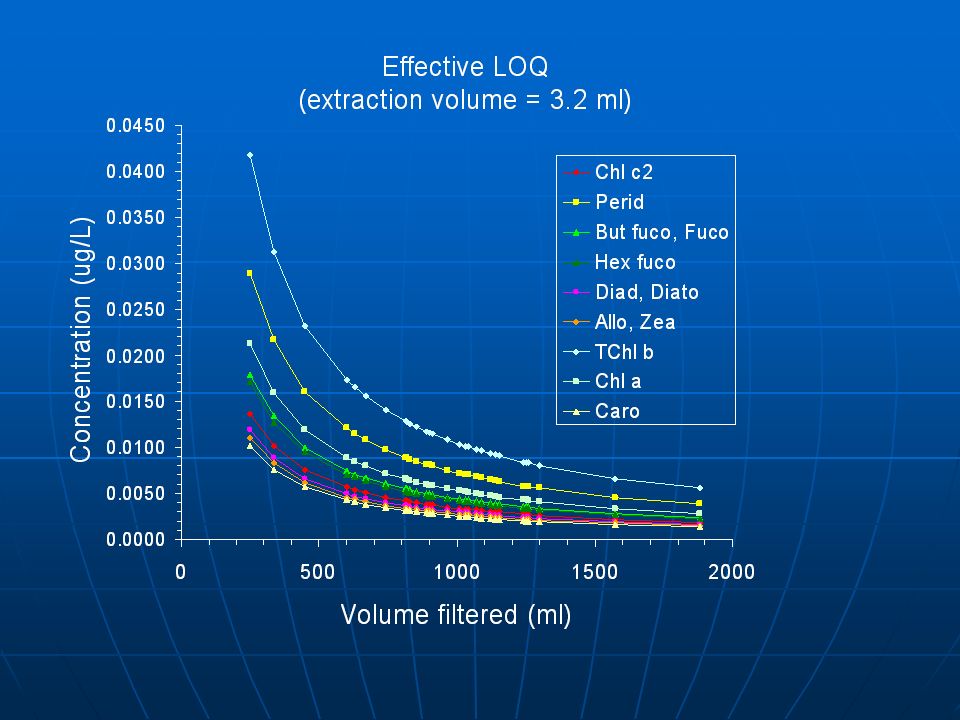
Data Reports from HPL Pigments not found and those with a SNR of 4 are given a concentration of 0.0001Pigments not found and those with a SNR of 4 are given a concentration of 0.0001 Graph of Effective LOQ (ug/L vs. filtration volume)Graph of Effective LOQ (ug/L vs. filtration volume) The ug/L of pigment in a sample for which the amount of pigment injected was at the instrument LOQ. Effective LOQ varies with changes in Vx and Vf. The ug/L of pigment in a sample for which the amount of pigment injected was at the instrument LOQ. Effective LOQ varies with changes in Vx and Vf. LOQ = amount of pigment that results in a SNR of 10 LOQ = amount of pigment that results in a SNR of 10
Graph of Effective LOQ (ug/L vs. filtration volume) The ug/L of pigment in a sample for which the amount of pigment injected was at the instrument LOQ. Effective LOQ varies with changes in Vx and Vf. The ug/L of pigment in a sample for which the amount of pigment injected was at the instrument LOQ. Effective LOQ varies with changes in Vx and Vf. LOQ = amount of pigment that results in a SNR of 10 LOQ = amount of pigment that results in a SNR of 10.")
19
HPL sample codes Horn Point Lab Sample Code PI Original PI Sample Code Cruise Name Sequential Sample Number 06-214Siegel, DavidDSPB179DS1948 06-214.5Siegel, DavidDSPB179DS1948 06-215Siegel, DavidDSPB179DS1949 06-216Siegel, DavidDSPB179DS1950 06-217Siegel, DavidDSPB179DS1951 06-218Siegel, DavidDSPB179DS1952

21
Pigment ratios (Trees et al, 2000)
")
Similar presentations


 Split or splitless Split ratio Injection volume FAQs- injection.>")
 VALIDATION of ANALYTICAL TEST METHODS.>")


 What accuracy and precision are required? How much sample do I have available,>")

 as one that is free of defects and performs those functions for which it was designed.>")
. You can freely download,>")


