Download presentation
Presentation is loading. Please wait.

2
Types of Maps and Map Projections http://www.youtube.com/watch?v=AI36MWAH54s

3
MAPS Maps are a visual representation of the Earth’s surface, drawn to scale and made for a specific purpose. Each unique map projection serves a particular purpose. 7/10 Armadillo Goode’s Homolosine

4
Types of Maps Physical maps show elevation, mountains, rivers, deserts etc…

5
Types of Maps Political maps show: countries cities capitals counties

6
Special purpose maps Maps designed for a special purpose. Highway maps, population maps, etc…

7
Maps have four properties. When you take a round globe and “flatten” it, one or more of these properties will be “distorted.” The properties of maps include: scale distance area direction

9
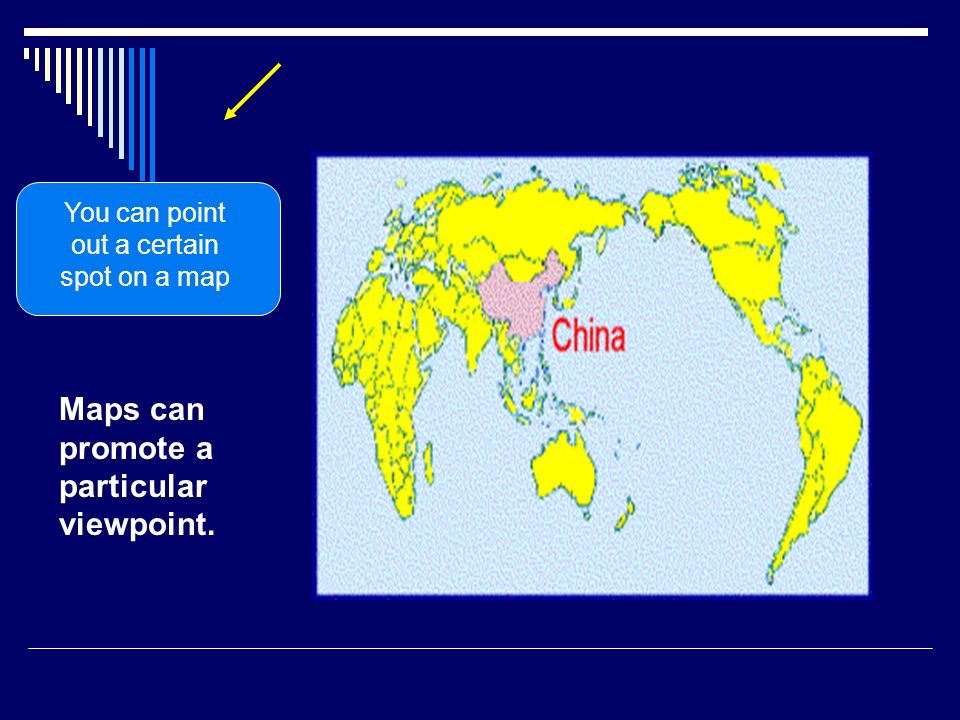
Maps can promote a particular viewpoint. You can point out a certain spot on a map

10
What is wrong with this map? Nothing. Check the compass.

11
Make a 4x5 chart for map projections, and add the top titles for each column ProjectionsWhat is distorted? DisadvantagesAdvantages

12
MAP PROJECTIONS Robinson Compromises Polar Areas Hard to see the poles Shows minimal distortion. Used by schools Projection What is distorted Disadvantages Advantages (what is it used for)
.")
13
The Robinson projection distorts all properties to a degree, but doesn’t distort any single property too much. Poles are distorted and properties further north and south are still a little larger than reality. Remember that you have to follow the longitude line on the curve *Very similar to the Eckert IV map

14
MAP PROJECTIONS Robinson Compromises Polar Areas Hard to see the poles Shows minimal distortion. Used by schools MercatorAreas larger near the poles. Greenland looks as large as South America Shows true direction. Used by ships navigators. Projection What is distorted Disadvantages Advantages (what is it used for)
.")
15
Notice the size of Greenland compared to South America or Africa. In reality, it is about the size of Argentina. Shapes are correct but sizes are distorted.

16
Mercator Projection While it “looks” larger at the top, note how the distance between latitude lines increases

17
This is the map used by ships navigators. The shapes of countries are correct.

18
MAP PROJECTIONS Robinson Compromises Polar Areas Hard to see the poles Shows minimal distortion. Used by schools MercatorAreas larger near the poles. Greenland looks as large as South America Shows true direction. Used by ships navigators. AzimuthalLatitude linesCan’t see the entire world on one map. Used by airline pilots to plot the best route around the globe. Projection What is distorted Disadvantages Advantages (what is it used for)
.")
19
Distances measured from the center are true. Distortion of other properties increases away from the center point. Note how a plane would fly over Greenland to get to Moscow.

20
Note the route planned on a Robinson Map. Adds unnecessary distance.

22
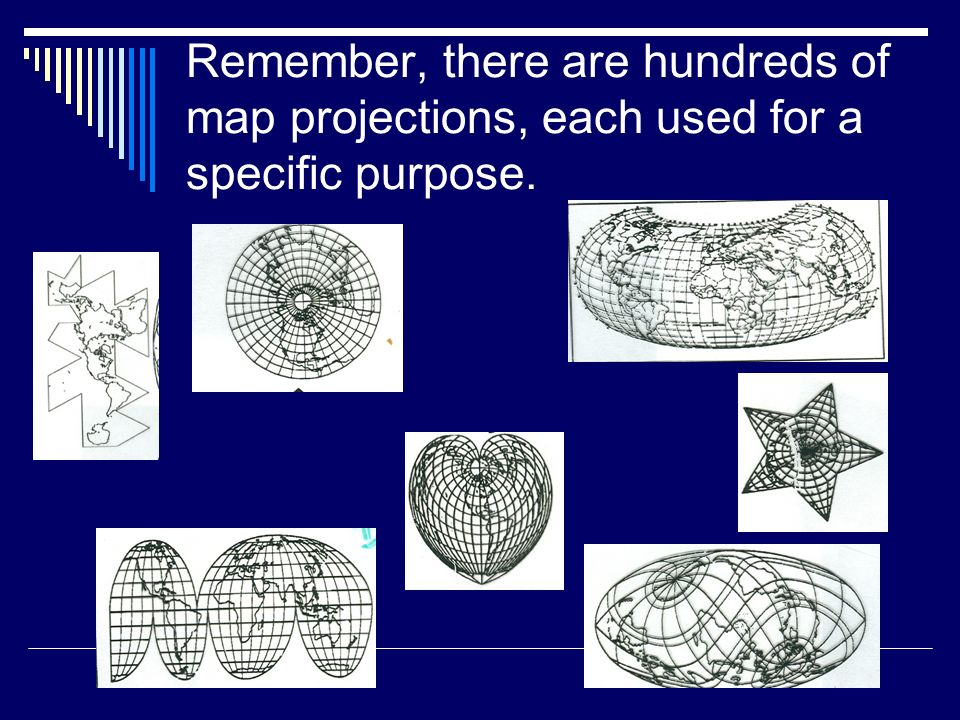
Remember, there are hundreds of map projections, each used for a specific purpose.

23
One Last Thing….. Tropic of Cancer The line of latitude that lies at 23 ½ degrees north of the equator Tropic of Capricorn The line of latitude that lies at 23 ½ degrees south of the equator Arctic Circle The line of latitude that lies 66 ½ degrees north of the equator Antarctic Circle The line of latitude that lies at 66 ½ degrees south of the equator

24
How Did They Get Their Names? Tropic of Cancer - at the time of its naming, the sun was positioned in the Cancer constellation during the June solstice Tropic of Capricorn - the sun was in the constellation Capricorn during the December solstice Artic Circle -It is the line of latitude at which the sun does not go below the horizon at midsummer. Similarly therefore it does not rise at midwinter. Antarctic Circle - There is an increase in the length of day and night time as you move south of the Antarctica Circle. It encircles the land mass of Antarctica. One of the five circles that circle the globe

25
http://www.youtube.com/watch?v=n8zBC2dvERM

Similar presentations


 to carry – Can have special purposes – Scales allow.>")


