Download presentation
Presentation is loading. Please wait.

1
“SPITZER observations of luminous obscured Quasars” Enrica Bellocchi in collaboration with A. Comastri, F. Pozzi, C. Vignali, J. Fritz, L. Pozzetti on behalf of the HELLAS2XMM collaboration AGN 8, Torino

2
Summary Summary Analysis and interpretation of Spitzer (IRAC & MIPS) data of a sample of 16 obscured Quasars selected in the 2-10 keV band from the 1.4 sq. deg. HELLAS2XMM survey (F x ≈ 10 -14 –10 -13 erg/sec/cm 2 ). Compute the SEDs and L bol Determination of torus physical parameters (e.g. optical depth)
. Compute the SEDs and L bol Determination of torus physical parameters (e.g. optical depth).")
3
The “obscuring” matter (TORUS) is composed by: 1.Dust : absorbs optical-UV radiation 2.Gas : absorbs soft X-ray radiation IR The radiation, coming from the accreting disk, is assorbed by the torus, thermally reprocessed and reemitted at longer wavelengths, tipically in the IR band (1÷1000 μm), less affected by obscuration → Spitzer data (IRAC + MIPS bands) permits the analysis of our sample !!! “Torus”

4
The sample Type 2 QSO selected in the hard-X-ray band from the HELLAS2XMM survey (F x ≈ 10 -14 – 10 -13 erg/sec/cm 2 ) characterized by the following values: Optical magnitude → 21.8 < R < 25.1 Redshift → 0.7 < z spec < 2 → 0.9 < z phot < 2.1 (R-K )≥ 5, faint in the optical band QSO IIX-ray Luminosity → L X > 10 44 erg/sec QSO II Column density → N H ≥ 10 22 cm -2
 characterized by the following values: Optical magnitude → 21.8 < R < 25.1 Redshift → 0.7 < z spec < 2 → 0.9 < z phot < 2.1 (R-K )≥ 5, faint in the optical band QSO IIX-ray Luminosity → L X > erg/sec QSO II Column density → N H ≥ cm -2")
5
X/O > 1 X/O > 1 → OBSCURATION Pozzi et al. 2007

6
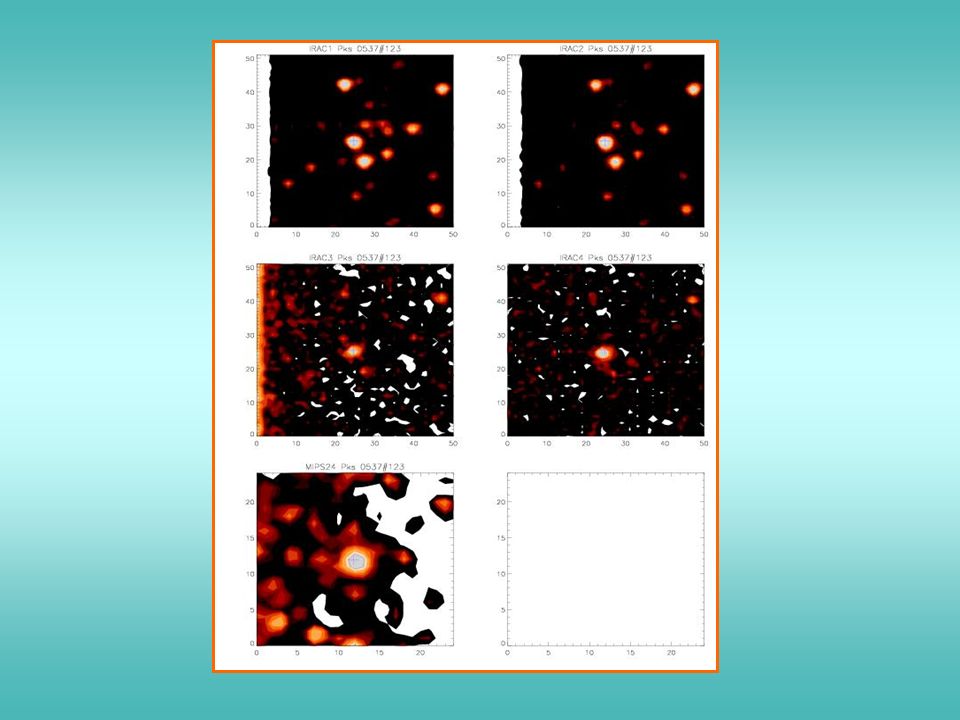
Spitzer observations SPITZER data (PI:Comastri) IRAC → IRAC bands (3.6, 4.5, 5.8, 8.0 μm) MIPS → MIPS band (24 μm) IRAC FOV ~ 5.2′ x 5.2′ Results: Irac1 Mips24 Results: Irac1 → 21 < S ν < 420 [μJy] Mips24 → 50 < S ν < 6900 [μJy] Each postage is (1′ x 1′) MIPS FOV ~ 5.4′ x 5.4′ Spitzer data analised with an IDL procedure
![Spitzer observations SPITZER data (PI:Comastri) IRAC → IRAC bands (3.6, 4.5, 5.8, 8.0 μm) MIPS → MIPS band (24 μm) IRAC FOV ~ 5.2′ x 5.2′ Results: Irac1 Mips24 Results: Irac1 → 21 < S ν < 420 [μJy] Mips24 → 50 < S ν < 6900 [μJy] Each postage is (1′ x 1′) MIPS FOV ~ 5.4′ x 5.4′ Spitzer data analised with an IDL procedure](http://images.slideplayer.com/38/10831646/slides/slide_6.jpg "Spitzer observations SPITZER data (PI:Comastri) IRAC → IRAC bands (3.6, 4.5, 5.8, 8.0 μm) MIPS → MIPS band (24 μm) IRAC FOV ~ 5.2′ x 5.2′ Results: Irac1 Mips24 Results: Irac1 → 21 < S ν < 420 [μJy] Mips24 → 50 < S ν < 6900 [μJy] Each postage is (1′ x 1′) MIPS FOV ~ 5.4′ x 5.4′ Spitzer data analised with an IDL procedure")
7
TORUS Results of theoretical SEDs: TORUS templates

8
GALAXY + TORUS templates

9
Theoretical Model Fritz et al. (2006) models GEOMETRY‘flared disk’GEOMETRY → ‘flared disk’ COMPOSITIONCOMPOSITION → Graphite & Silicate grains in equal percentages PARAMETERSDifferent PARAMETERS → α, β, Θ, τ eq (9.7μm), R, ψ α, β → density distribution Θ → aperture ‘torus’ angle τ eq (9.7μm) → optical depth R → R = R max / R min ψ → line of sight (with respect to the z polar axis)
 models GEOMETRY‘flared disk’GEOMETRY → ‘flared disk’ COMPOSITIONCOMPOSITION → Graphite & Silicate grains in equal percentages PARAMETERSDifferent PARAMETERS → α, β, Θ, τ eq (9.7μm), R, ψ α, β → density distribution Θ → aperture ‘torus’ angle τ eq (9.7μm) → optical depth R → R = R max / R min ψ → line of sight (with respect to the z polar axis).")
10
“Matching” the IR SEDs with Fritz et al. (2006) models “Matching” the IR SEDs with Fritz et al. (2006) models HOW some parameters affect the observed spectrum for different line-of-sight inclinations: ♦ τ eq (9.7μm) → low Silicate feature in emission ! ♦ τ eq (9.7μm) → high ♦ High R → more and cold dust Silicate feature in absorption !
 models HOW some parameters affect the observed spectrum for different line-of-sight inclinations: ♦ τ eq (9.7μm) → low Silicate feature in emission . ♦ τ eq (9.7μm) → high ♦ High R → more and cold dust Silicate feature in absorption !.")
11
τ ψ (9.7μm) distribution τ ψ (9.7μm) distribution Torus low Torus → low optical depth Galaxy & Torus higher Galaxy & Torus → higher optical depth R ES UL TS (I) (I)
 distribution τ ψ (9.7μm) distribution Torus low Torus → low optical depth Galaxy & Torus higher Galaxy & Torus → higher optical depth R ES UL TS (I) (I)")
12
Line of sight (ψ) distribution Torusψ Torus template → 60° ≤ ψ ≤ 90° Galaxy & Torusψ Galaxy & Torus template → 40° ≤ ψ ≤ 90° ‘Edge-on’ view
 distribution Torusψ Torus template → 60° ≤ ψ ≤ 90° Galaxy & Torusψ Galaxy & Torus template → 40° ≤ ψ ≤ 90° ‘Edge-on’ view")
13
Results (II):Results (II): AGN physical parameters Bolometric luminosity → Bolometric luminosity bol = L IR + L X L bol = L IR + L X 1-1000 μm covering factor corrected 0.5-500 keV extrapolated L bol ≈ 10 45 ÷ 47 erg/sec L bol ≈ 10 45 ÷ 47 erg/sec Bolometric correction → Bolometric correction k bol,2-10 keV = L bol / L (2-10keV) k bol,2-10 keV ≈ 70 ≈ 70 (min: 8 - max: 145) … LARGE SPREAD!!!
:Results (II): AGN physical parameters Bolometric luminosity → Bolometric luminosity bol = L IR + L X L bol = L IR + L X μm covering factor corrected keV extrapolated L bol ≈ ÷ 47 erg/sec L bol ≈ ÷ 47 erg/sec Bolometric correction → Bolometric correction k bol,2-10 keV = L bol / L (2-10keV) k bol,2-10 keV ≈ 70 ≈ 70 (min: 8 - max: 145) … LARGE SPREAD!!!")
14
♣ Galaxy & Torus template (Pozzi et al. 2007) → ‘low’ k bol ♣ Torus template → ‘high’ k bol Considering a fixed k bol for different sources may be WRONG, even in samples selected in the same way!!! Pozzi’s et al. 2007 sample Torus sample QUASARII
 → ‘low’ k bol ♣ Torus template → ‘high’ k bol Considering a fixed k bol for different sources may be WRONG, even in samples selected in the same way!!. Pozzi’s et al sample Torus sample QUASARII.")
15
Summary Data Spitzer analysis of 16 QSO II X-ray selected → All revealed! Optical depth τ eq (9.7μm) = 0.1 (Torus template) → larger τ eq (9.7μm) (Galaxy & Torus template) Line of sight ψ → near equatorial plane (Type II !) Bolometric correction ≈ 70 (8÷145) Future perspectives 70160 μm data Analyse the 70 and 160 μm data X-ray data And the X-ray data in the SEDs
 = 0.1 (Torus template) → larger τ eq (9.7μm) (Galaxy & Torus template) Line of sight ψ → near equatorial plane (Type II !) Bolometric correction ≈ 70 (8÷145) Future perspectives μm data Analyse the 70 and 160 μm data X-ray data And the X-ray data in the SEDs.")
17
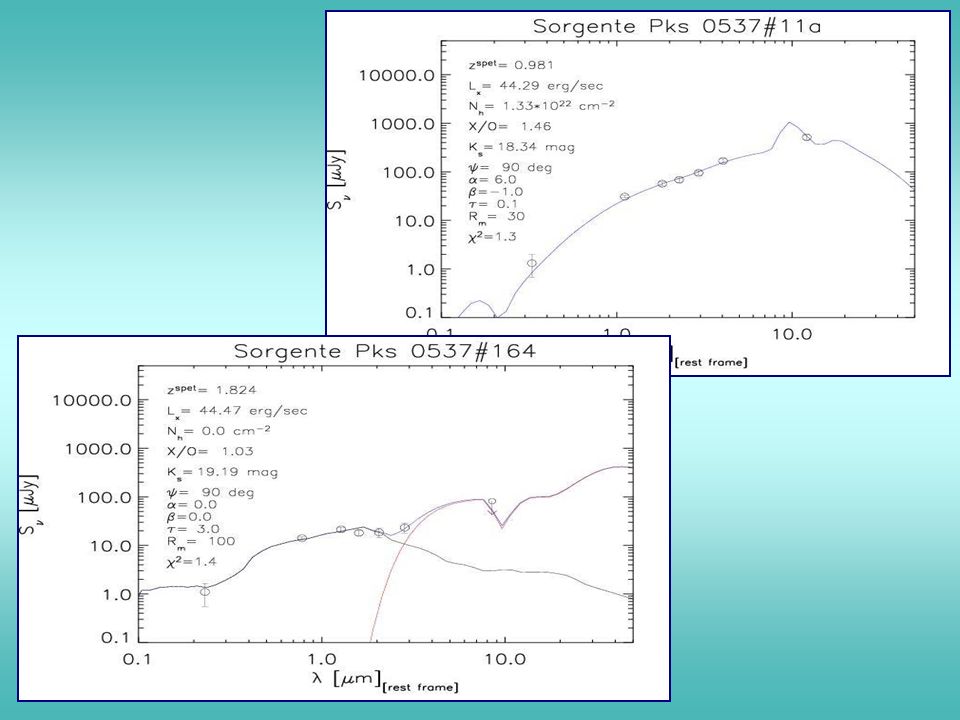
Spectral Energy Distributions (SEDs) Analysis Interpretative analysis → 2 different approaches: Empirical:Empirical: Elvis et al. 1994 → type I Extincted Richards et al. 2006 → type I with Polletta et al. 2006 → type I/II SMC law ( R V = A V /E(B-V) = 2.93 ) Theoretical:Theoretical: Fritz et al. 2006 Allows the estimate of the physical torus parameters (density, optical depth, column density, ecc.)
 = 2.93 ) Theoretical:Theoretical: Fritz et al Allows the estimate of the physical torus parameters (density, optical depth, column density, ecc.).")
18
a) Results of empirical SEDs from the χ 2 test: A V ≈ 2 EXTINCTION!!! Colour excess E(B-V) = 0.4 – 0.8 → A V ≈ 2 EXTINCTION!!! (R V = A V /E(B-V) = 2.93; SMC)
 = 0.4 – 0.8 → A V ≈ 2 EXTINCTION!!. (R V = A V /E(B-V) = 2.93; SMC).")
19
IRAC & MIPS FOV 42' x 30 ' total dim

22
Column density (N H ) → “observed” vs “misured” Results: 1.Gas/Dust ratio > Galactic ratio ≈ 5 · 10 21 atoms/cm 2 /mag 2.2 sources (with galaxy) may be ‘Compton thick’ (N H >10 24 cm -2 ) → Can I see the reflected component in X-ray band ??
 → observed vs misured Results: 1.Gas/Dust ratio > Galactic ratio ≈ 5 · atoms/cm 2 /mag 2.2 sources (with galaxy) may be ‘Compton thick’ (N H >10 24 cm -2 ) → Can I see the reflected component in X-ray band")
23
Covering factor covering factor Point-like sources → 0 < covering factor < 0.6 covering factor Elliptical-like sources → 0.2 < covering factor < 0.9

Similar presentations

>")
>")
 Preston, September 2011.>")


 of type 1 AGN in the optical, Near and Far-UV and X-ray energy bands. Constrain the luminosity of the.>")
 on behalf of the XMM-COSMOS team.>")


 Michael Brotherton, Danny Dale (University of.>")
, Nick Seymour, Anna Sajina, Lisa Storrie- Lombardi, Lee Armus (SSC) Andreea Petric.>")


 Jason Melbourne (Caltech) B.T. Soifer, Lee Armus, Keith Matthews, Vandana Desai, Arjun Dey,>")

