Download presentation
Presentation is loading. Please wait.

2
Study the spectral energy distribution (SED) of type 1 AGN in the optical, Near and Far-UV and X-ray energy bands. Constrain the luminosity of the accretion disk emission component Derive the hard X-ray bolometric correction factors for a significant sample of Type 1 AGN spanning a large range in z and L x. Accretion rate density Total accreted mass Active Galactic Nuclei, powered by accretion onto a Super- massive Black Hole (SMBH), emit over the entire electromagnetic spectrum with the peak of the accretion disk emission in the far-UV, a wavelength range historically difficult to investigate.
, emit over the entire electromagnetic spectrum with the peak of the accretion disk emission in the far-UV, a wavelength range historically difficult to investigate..")
3
The XMM-Newton Bright Survey in pills XMM fields used: 237 Covered Area (deg 2 ): 28 Sources in the bright sample(BSS,0.5-4.5keV): 389 “ “ “hard” bright sample(HBSS,4.5-7-5 keV): 67 (56 sources are in common) Total Sources: 400 (f x >~7x10 -14 erg cm -2 s -1 ) Della Ceca et al., 2004 Caccianiga et al., 2008 The starting point of our study is a sample of 304 AGNs, counting 263 type 1 AGNs having intrinsic N H <4 ·10 21 cm -2, belonging to the XMM-Newton Bright Serendipitous Survey (XBS).
: 28 Sources in the bright sample(BSS, keV): 389 hard bright sample(HBSS, keV): 67 (56 sources are in common) Total Sources: 400 (f x >~7x erg cm -2 s -1 ) Della Ceca et al., 2004 Caccianiga et al., 2008 The starting point of our study is a sample of 304 AGNs, counting 263 type 1 AGNs having intrinsic N H <4 ·10 21 cm -2, belonging to the XMM-Newton Bright Serendipitous Survey (XBS).")
4
GALEX (Galaxy Evolution Explorer) is a NASA Small Explorer mission that is performing surveys of different depths/sky coverage in the far-UV and near-UV The GALEX mission in pills
 is a NASA Small Explorer mission that is performing surveys of different depths/sky coverage in the far-UV and near-UV The GALEX mission in pills")
5
CROSS CORRELATION WITH GALEX 160 matches 63 upper limits 263 X-ray selected AGN 1, with N H <4 ·10 21 cm -2 CROSS CORRELATION WITH SDSS 82 sources having data from XBS-GALEX-SDSS All these sources have an X-ray spectra from XMM-Newton which allows us to derive X- ray luminosities and spectral properties (e.g. Γ, Nh). Corral, Della Ceca, Caccianiga and Severgnini, 2010, in preparation A. Corral:this meeting 40 sources out GALEX field
. Corral, Della Ceca, Caccianiga and Severgnini, 2010, in preparation A. Corral:this meeting 40 sources out GALEX field.")
6
The data points from the SDSS and from GALEX were described using a basic accretion disk model (DISKPN model in the XSPEC package). The maximum disc temperature was chosen in the range kT≈1-64 eV, and the normalization has been left has free parameter. The model

7
A different spectral slope above 5000Å ? The slope of the continum changes abruptly at around 5000Å (rest wavelength), becoming steeper untill 8555 Å (stellar light from the host galaxy? real change in the quasar continum?) As we want to analise the component of emission of the accretion disc, we decide to use only fluxes corresponding to λ rest < 5000Å Composite spectra of ~2200 SDSS quasars (Vanden Berk et al. 2001)
, becoming steeper untill 8555 Å (stellar light from the host galaxy. real change in the quasar continum ) As we want to analise the component of emission of the accretion disc, we decide to use only fluxes corresponding to λ rest < 5000Å Composite spectra of ~2200 SDSS quasars (Vanden Berk et al. 2001).")
8
Observer Our Galaxy AGN Galactic reddening: Allen law(1976) R v =3.1 E B-V = A B – A V available from the GALEX database Intrinsic AGN reddening The exact shape of the extinction curve in the Near-Far-UV is still a matter of debate Gaskell e Benker, 2007 determined a parametrized average extinction law from the study of 14 AGN, with FUSE and HST data. Bohlin et al. 1978 Host Galaxy Hydrogen clouds (Lymanα forest)
.")
9
About 20% of the sources have optical SEDs showing a hardening at the optical wavelengths. Optical spectra of these sources contamination by the stars in the host galaxy Break at 4000 Å : indicator of the importance of the galaxy star-light in the total emission of the source. Calcium- break F + e F - mean flux densities in the regions 4050- 4250 Å and 3750-3950Å (in the source rest- frame) respectively. AGN Host galaxy AGN + host galaxy Calcium break FLUX ENERGY (kev) SDSS GALEX SED OF ONE OF THE SOURCES
 respectively. AGN Host galaxy AGN + host galaxy Calcium break FLUX ENERGY (kev) SDSS GALEX SED OF ONE OF THE SOURCES.")
10
Model formulated to correct for the emission of the host galaxy Model of a normal galaxy: Heaviside function such that Δ=50% AGN: α ν =-0.44 (α λ =-1.56). (Vanden Berk et al. 2001) We calculated the resulting Δ from the combined emission of the AGN (with different normalizations) and host galaxy FLUX RATIO AGN/GALAXY Break at 4000 Å HOST GALAXY AGN H.GALAXY+AGN FLUX λ (Å) HOST GALAXY AGN H. GALAXY+AGN FLUX λ (Å)
 We calculated the resulting Δ from the combined emission of the AGN (with different normalizations) and host galaxy FLUX RATIO AGN/GALAXY Break at 4000 Å HOST GALAXY AGN H.GALAXY+AGN FLUX λ (Å) HOST GALAXY AGN H. GALAXY+AGN FLUX λ (Å).")
11
HOST GALAXY AGN GAL+AGN AGN HOST GALAXY GAL+AGN Δ=17.3% Δ=33.2% 0. ENERGIA (keV) FLUX ENERGY (keV) SDSS GALEX FLUX 0. ENERGY (keV) SDSS GALEX AFTER CORRECTION BEFORE CORRECTION
 FLUX ENERGY (keV) SDSS GALEX FLUX 0. ENERGY (keV) SDSS GALEX AFTER CORRECTION BEFORE CORRECTION.")
12
The presence of emission lines within the filter bandpass can contribute significantly to the observed magnitudes of an AGN. Since this effect is a strong function of redshift, we need to take it into account to derive the continuum… Assuming R ~1 Average spectra and equivalent widths of the emission lines present in the energy bands we are studying, calculated by Telfer et al. 2002, from the spectra of 184 quasars with z>0.33. FLUX WAVELENGTH (Å) TIPICAL SPECTRA OF AN AGN
 TIPICAL SPECTRA OF AN AGN.")
13
FLUSSI OTTICO-UV FLUSSI X ENERGIA (keV) FLUSSI OTTICO-UV FLUSSI X ENERGIA (keV) FLUSSI OTTICO-UV FLUSSI X ENERGIA (keV) OPTICAL-UV X-ray XMM ENERGIA (keV) OPTICAL-UV X-ray (XMM) ENERGIA (keV) Median maximum temperature : kT ≈ 4 eV
 FLUSSI OTTICO-UV FLUSSI X ENERGIA (keV) FLUSSI OTTICO-UV FLUSSI X ENERGIA (keV) OPTICAL-UV X-ray XMM ENERGIA (keV) OPTICAL-UV X-ray (XMM) ENERGIA (keV) Median maximum temperature : kT ≈ 4 eV")
14
2-10 keV luminosity Available for every object from the X-ray spectral analysis (Corral et al. 2010) 0.1-100 keVluminosity Extrapolated from the 2-10 keV luminosity, using the spectal index measured for every sorce Accretion disk luminosity Calculated as the integral of the SEDs in the optical-UV bands. L bol =L disc + L 0.1-100 keV
 keVluminosity Extrapolated from the 2-10 keV luminosity, using the spectal index measured for every sorce Accretion disk luminosity Calculated as the integral of the SEDs in the optical-UV bands. L bol =L disc + L keV.")
15
82 sources with XBS-GALEX-SDSS data discussed so far 78 sources with XBS-GALEX data 63 sources with XBS- GALEX upper limits UV fluxes or their upper limits were fitted with the same model with a T max fixed to kT ≈ 4 eV

16
Strong dependence of the accretion disk luminosities to the X-ray luminosities the two emission mechanisms are highly correlated CORRELATION L DISK – L 2-10keV Best-fit bisector relation: In good agreement with previous results on X-ray selected sources: Lusso et al. 2010: β=1.31±0.038 78 sources XBS-GALEX 82 sources XBS-GALEX- SDSS 63 sources XBS- GALEX upper limits

17
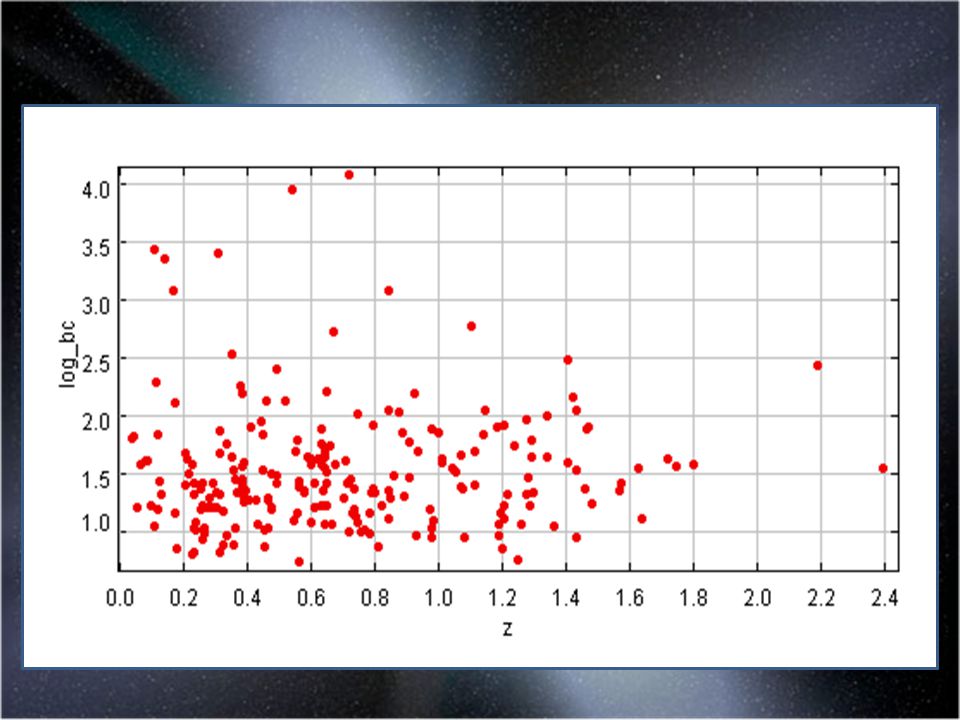
We don’t find any significant correlation between bolometrc correction and X-ray luminosities This is probably due to a very large spread in the distributions of the hard X-ray bolometric corrections, going from ~5 up to few hundred, implying a large dispersion in the mean SED BOLOMETRIC CORRECTION AGAINST HARD X-RAY LUMINOSITY 63 sources XBS- GALEX upper limits 78 sources XBS-GALEX 82 sources XBS-GALEX- SDSS

18
We used a sample of 223 sources spanning a large range in X-ray luminosities (L X ≈10 41 – 10 46 erg/s) and redshift (z≈0-2.4) and we find : A high correlation between the accretion disk luminosity and the X-ray luminosity, in agreement with previous works on X-ray selected AGNs. A very large spread in the distributions of the hard X-ray bolometric corrections, going from ~5 up to few hundred -> a large intrinsic dispersion in the mean SED;

19
The data points from the SDSS and from GALEX were described using a basic accretion disk model (DISKPN model in the XSPEC package). The maximum disc temperature was chosen in the range kT≈1-64 eV, while the normalization (e.g the luminosity) of the accretion disk was set to reproduce the Galex NUV and FUV data. ERRORS NUV-FUV fluxes: we used the errors given on the GALEX database, so these are Poisson errors (they don’t include systematic components) Optical fluxes : Systematic effects of using non-contemporaneous data were accounted for including errors in the SDSS magnitudes. These are due to long term variability (90% confidence error ~0.6 mag ; Becker et al. 2005)
 of the accretion disk was set to reproduce the Galex NUV and FUV data. ERRORS NUV-FUV fluxes: we used the errors given on the GALEX database, so these are Poisson errors (they don’t include systematic components) Optical fluxes : Systematic effects of using non-contemporaneous data were accounted for including errors in the SDSS magnitudes. These are due to long term variability (90% confidence error ~0.6 mag ; Becker et al. 2005).")
21
Allen law (1976), using the typical value of R V =3.1 for the diffuse interstellar medium in our Galaxy. Galactic E B-V from GALEX database

22
z<1 (75% of the sources): Flux reduction <15% FUV; <5% NUV 1<z<1.6 (25% of the sources): Flux reduction 15-50% FUV; 5-20% NUV Optical depth due to the presence of neutral hydrogen, asgainst the redshift, for the FUV and NUV bands of ( adapted from Ghisellini et al., 2010, MNRAS, in press).
: Flux reduction <15% FUV; <5% NUV 1<z<1.6 (25% of the sources): Flux reduction 15-50% FUV; 5-20% NUV Optical depth due to the presence of neutral hydrogen, asgainst the redshift, for the FUV and NUV bands of ( adapted from Ghisellini et al., 2010, MNRAS, in press).")
23
Ib: Intrinsic AGN Reddening The exact shape of the extinction curve in the Near-Far-UV is still a matter of debate. It is clear that the circumnuclear dust in AGN is different from the average properties of the dust in the ISM in our Galaxy, SMC and LMC Gaskell and Benker, 2007 determined a parametrized average extinction law from the study of 14 AGN, with FUSE and HST data. The intrinsic source reddening, E B-V, has been evaluated using the standard gas to dust ratio of our galaxy : N H (or upper limits, 75% of the our objects) derived directly from the best fit X-ray spectral model (Corral et al., 2010)
 derived directly from the best fit X-ray spectral model (Corral et al., 2010).")
24
the Lyman α is the line with stronger contribution, in the FUV and NUV bands

25
Distribution of bolometric luminosities Median of L bol : 3 x 10 45 erg/s

26
At higher accretion disk luminosities correspond higher temperatures, as expected from the relation T÷L 1/4 Median of the distribution peak of emission≈ 1000 Å Distribution of the maximum temperatures of the accretion disk

28
78 sources over the 160 having UV data don’t have optical information We fitted the UV fluxes or upper limits with a model with a maximum temperature of the accretion disk fixed to kT ≈ 4 eV 63 sources have just upper limits on the UV fluxes

29
82 sorg. 82 sorg., alti flussi X 82 sorg., bassi flussi X 160 sorg. 160 sorg., alti flussi X 160 sorg., bassi flussi X 223 sorg

30
pendenzasigma 82 sorgenti1.1190.080 40 sorgenti(flussi X bassi)1.1870.094 42 sorgenti(flussi X alti)1.1050.114 160 sorgenti1.103.050 160 sorgenti(flussi X bassi)1.1580.086 160 sorgenti(flussi X alti)1.0780.066 223 sorgenti1.250
 sorgenti(flussi X alti) sorgenti sorgenti(flussi X bassi) sorgenti(flussi X alti) sorgenti1.250")
31
222 sources160 sources82 sources Spearman rho-0.051-0.082-0.101 Spearman prob. of no correlation 0.4460.300.365 Kendall probability 0.4640.320.423

34
Marconi et al. 2004 relation Best-fit relation

35
α OX vs L 2500Å

36
β =1

Similar presentations


>")

 ~ 27; about 30%>")


 Leicester.>")


 Michael Brotherton, Danny Dale (University of.>")


 Meg Urry, Priya Natarajan,>")

