Download presentation
Presentation is loading. Please wait.

1
The first paper of this series (J Physiol 116: 424-448. Hodgkin, Huxley, and Katz. Current-Voltage Relationship in Nerve) deals with the experimental method and with the behaviour of the membrane in a normal ionic environment. The second (J Physiol 116: 449-472. Hodgkin & Huxley. Na and K current in Nerve Membrane) is concerned with the effect of changes in sodium concentration and with a resolution of the ionic current into sodium and potassium currents. Permeability to these ions may conveniently be expressed in units of ionic conductance. The third paper (J Physiol 116: 473-496, Hodgkin & Huxley. Membrane Conductance in Nerve) describes the effect of sudden changes in potential on the time course of the ionic conductances, while the fourth (J Physiol 116: 497-506, Hodgkin & Huxley. Membrane Potential and Na Conductance) deals with the inactivation~process which reduces sodium permeability during the falling phase of the spike. The fifth paper (J Physiol 117:500-544, Hodgkin & Huxley, Membrane Current in Nerve) concludes the series and shows that the form and velocity of the action potential may be calculated from the results described previously. Hodgkin & Huxley 의 1952 년 Journal of Physiology 논문
 deals with the experimental method and with the behaviour of the membrane in a normal ionic environment. The second (J Physiol 116: Hodgkin & Huxley. Na and K current in Nerve Membrane) is concerned with the effect of changes in sodium concentration and with a resolution of the ionic current into sodium and potassium currents. Permeability to these ions may conveniently be expressed in units of ionic conductance. The third paper (J Physiol 116: , Hodgkin & Huxley. Membrane Conductance in Nerve) describes the effect of sudden changes in potential on the time course of the ionic conductances, while the fourth (J Physiol 116: , Hodgkin & Huxley. Membrane Potential and Na Conductance) deals with the inactivation~process which reduces sodium permeability during the falling phase of the spike. The fifth paper (J Physiol 117: , Hodgkin & Huxley, Membrane Current in Nerve) concludes the series and shows that the form and velocity of the action potential may be calculated from the results described previously. Hodgkin & Huxley 의 1952 년 Journal of Physiology 논문.")
2
Hypothesis: nervous conduction depends on a specific increase in permeability which allows Na+ to move from the more concentrated outside to the more diluted inside.

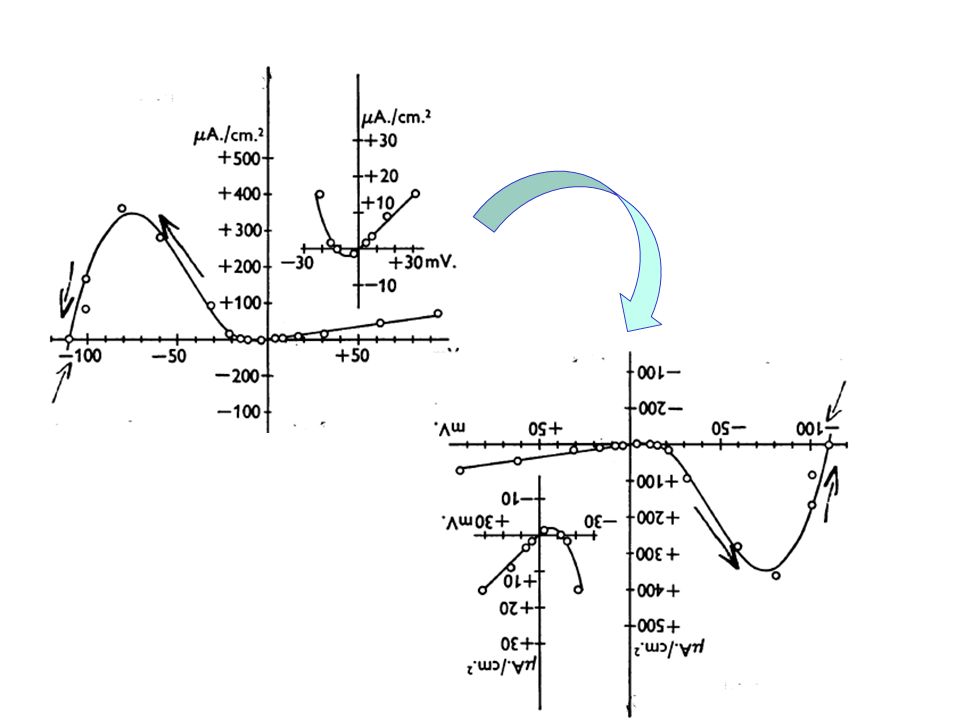
9
The total membrane current density (I) is negligible at times greater than 200 sec after application of the short shock. This means that the ionic current density (I i ) must be equal to the product of the membrane capacity per unit area (C M ) and the rate of depolarization. Thus if I= 0, Equation (1) becomes When the membrane potential is increased by anodal shocks the ionic current associated with the change in potential is in the-inward direction. This means that the original membrane potential must be restored by an inward transfer of positive charge through the membrane. If the membrane potential is depolarized by less than 12 mV., ionic current is outward and again restores the resting condition by repolarizing the membrane capacity. At V = -12 mV., I i is zero so that the membrane potential can remain in a state of unstable equilibrium. Between V= - 110 mV. And V -12 mV., I i is inward so that the membrane continues to depolarize until it reaches V =-110 mV. If the initial depolarization is greater than 110 mV. I i is outward which means that it will repolarize the membrane towards V =-110 mV. Fig. 10. Relation between ionic current density (Ii) and displacement of membrane potential (V). Abscissa: displacement of membrane potential from its resting value (anodal displacement shown positive). Ordinate: ionic current density obtained from –Cm*dV/dt (inward current shown positive). (C M =0.74pF/cm 2 ; temperature 6.30 C. Measurements made 0-29 msec. after application of shock.
 must be equal to the product of the membrane capacity per unit area (C M ) and the rate of depolarization. Thus if I= 0, Equation (1) becomes When the membrane potential is increased by anodal shocks the ionic current associated with the change in potential is in the-inward direction. This means that the original membrane potential must be restored by an inward transfer of positive charge through the membrane. If the membrane potential is depolarized by less than 12 mV., ionic current is outward and again restores the resting condition by repolarizing the membrane capacity. At V = -12 mV., I i is zero so that the membrane potential can remain in a state of unstable equilibrium. Between V= mV. And V -12 mV., I i is inward so that the membrane continues to depolarize until it reaches V =-110 mV. If the initial depolarization is greater than 110 mV. I i is outward which means that it will repolarize the membrane towards V =-110 mV. Fig. 10. Relation between ionic current density (Ii) and displacement of membrane potential (V). Abscissa: displacement of membrane potential from its resting value (anodal displacement shown positive). Ordinate: ionic current density obtained from –Cm*dV/dt (inward current shown positive). (C M =0.74pF/cm 2 ; temperature 6.30 C. Measurements made 0-29 msec. after application of shock..")
11
Fig. 12. Records of membrane current under a voltage clamp. The displacement of membrane potential (V) is given in millivolts by the number attached to each record. Inward current is shown as an upward deflexion.
 is given in millivolts by the number attached to each record. Inward current is shown as an upward deflexion..")
12
Fig. 13. Relation between membrane current density and membrane potential. Inward current density is taken as positive and the membrane potential is given in the sense external potential minus the internal potential. at 0.63 ms at steady state

15
The first paper of this series deals with the experimental method and with the behaviour of the membrane in a normal ionic environment. The second (Hodglin & Huxley, 1952 a) is concerned with the effect of changes in sodium concentration and with a resolution of the ionic current into sodium and potassium currents. Permeability to these ions may conveniently be expressed in units of ionic conductance. The third paper (Hodgkin & Huxiey, 1952b) describes the effect of sudden changes in potential on the time course of the ionic conductances, while the fourth (Hodgkin & Huxley, 1952c) deals with the inactivation~process which reduces sodium permeability during the falling phase of the spike. The fifth paper (Hodgkin & Huxley, 1952d) concludes the series and shows that the form and velocity of the action potential may be calculated from the results described previously.
 is concerned with the effect of changes in sodium concentration and with a resolution of the ionic current into sodium and potassium currents. Permeability to these ions may conveniently be expressed in units of ionic conductance. The third paper (Hodgkin & Huxiey, 1952b) describes the effect of sudden changes in potential on the time course of the ionic conductances, while the fourth (Hodgkin & Huxley, 1952c) deals with the inactivation~process which reduces sodium permeability during the falling phase of the spike. The fifth paper (Hodgkin & Huxley, 1952d) concludes the series and shows that the form and velocity of the action potential may be calculated from the results described previously..")
16
Sea waterCholine sea water Sea water Records of membrane current during 'voltage clamps'.

21
Fig. 9. Maximum sodium conductance Fig. 10. Maximum potassium conductance

22
Fig. 11. Maximum rates of rise of sodium conductance Fig. 12. Maximum rates of rise of potassium conductance

23
The first paper of this series deals with the experimental method and with the behaviour of the membrane in a normal ionic environment. The second (Hodglin & Huxley, 1952 a) is concerned with the effect of changes in sodium concentration and with a resolution of the ionic current into sodium and potassium currents. Permeability to these ions may conveniently be expressed in units of ionic conductance. The third paper (Hodgkin & Huxiey, 1952b) describes the effect of sudden changes in potential on the time course of the ionic conductances, while the fourth (Hodgkin & Huxley, 1952c) deals with the inactivation~process which reduces sodium permeability during the falling phase of the spike. The fifth paper (Hodgkin & Huxley, 1952d) concludes the series and shows that the form and velocity of the action potential may be calculated from the results described previously.
 is concerned with the effect of changes in sodium concentration and with a resolution of the ionic current into sodium and potassium currents. Permeability to these ions may conveniently be expressed in units of ionic conductance. The third paper (Hodgkin & Huxiey, 1952b) describes the effect of sudden changes in potential on the time course of the ionic conductances, while the fourth (Hodgkin & Huxley, 1952c) deals with the inactivation~process which reduces sodium permeability during the falling phase of the spike. The fifth paper (Hodgkin & Huxley, 1952d) concludes the series and shows that the form and velocity of the action potential may be calculated from the results described previously..")
25
Fig. 2. Records of membrane current associated with depolarization of 97.5 mV.

27
Fig. 8. Time course of membrane current associated with change in membrane potential

28
Fig. 9. Relation between rate constant determining decline of sodium conductance and potential to which membrane is repolarized.

29
Fig. 10. Time course of ionic currents associated with depolarizations of 32 mV 51 mV.

30
Fig. 14. Effect of membrane potential on the rate constant determining decline of potassium conductance. Fig. 13. A, ionic current associated with depolarization of 25 mV in choline sea water.

31
The first paper of this series deals with the experimental method and with the behaviour of the membrane in a normal ionic environment. The second (Hodglin & Huxley, 1952 a) is concerned with the effect of changes in sodium concentration and with a resolution of the ionic current into sodium and potassium currents. Permeability to these ions may conveniently be expressed in units of ionic conductance. The third paper (Hodgkin & Huxiey, 1952b) describes the effect of sudden changes in potential on the time course of the ionic conductances, while the fourth (Hodgkin & Huxley, 1952c) deals with the inactivation~process which reduces sodium permeability during the falling phase of the spike. The fifth paper (Hodgkin & Huxley, 1952d) concludes the series and shows that the form and velocity of the action potential may be calculated from the results described previously.
 is concerned with the effect of changes in sodium concentration and with a resolution of the ionic current into sodium and potassium currents. Permeability to these ions may conveniently be expressed in units of ionic conductance. The third paper (Hodgkin & Huxiey, 1952b) describes the effect of sudden changes in potential on the time course of the ionic conductances, while the fourth (Hodgkin & Huxley, 1952c) deals with the inactivation~process which reduces sodium permeability during the falling phase of the spike. The fifth paper (Hodgkin & Huxley, 1952d) concludes the series and shows that the form and velocity of the action potential may be calculated from the results described previously..")
32
Fig. 1. Development of 'inactivation' during constant depolarization of 8 mV. Fig. 2. Removal of 'inactivation' at +31 mV.

36
Fig. 7. Recovery from inactivation. Fig. 6. Membrane currents associated with two square waves applied in succession.

Similar presentations


 Ian Parker Lecture # 4 - The Hodgkin- Huxley Axon>")


>")

![1 5. Chemical basis of action potentials a. Sodium hypothesis: (Hodgkin and Katz, 1949) [Na + ] e reduction affects a.p., not E M Proposed Na + hypothesis:](/16/5108612/big_thumb.jpg "1 5. Chemical basis of action potentials a. Sodium hypothesis: (Hodgkin and Katz, 1949) [Na + ] e reduction affects a.p., not E M Proposed Na + hypothesis:>")

