Download presentation
Presentation is loading. Please wait.

1
E XPLORE - BY -E XAMPLE : A N A UTOMATIC Q UERY S TEERING F RAMEWORK FOR I NTERACTIVE D ATA E XPLORATION By Kyriaki Dimitriadou, Olga Papaemmanouil and Yanlei Diao

2
A GENDA Introduction to AIDE Data exploration IDE: interactive data exploration AIDE: automated interactive data exploration Machine learning Supervised learning: Decision tree Unsupervised learning: K-means Measure accuracy AIDE framework AIDE model: Data classification Query formulation Space exploration 1. Relevant object discovery 2. Misclassifies exploitation 3. Boundary exploitation AIDE model summary Conclusions

3
WHAT IS AIDE? A UTOMATED INTERACTIVE DATA EXPLORATION

4
E XPLORE DATA TO FIND AN APARTMENT BUT MOM I DON’T WANT TO MOVE!

5
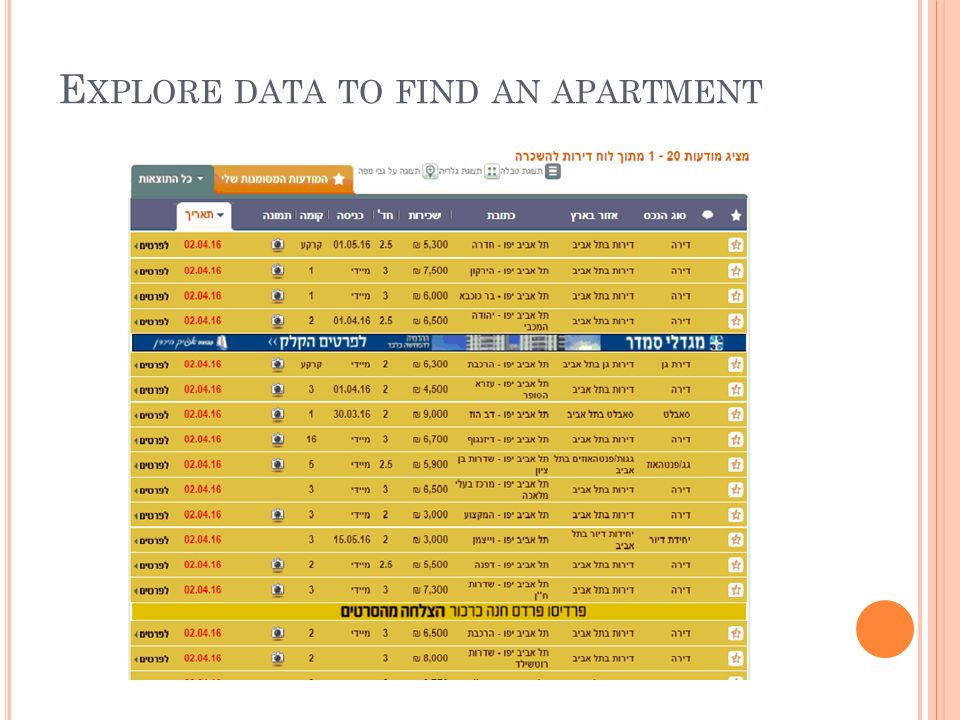
E XPLORE DATA TO FIND AN APARTMENT

7
D ATA E XPLORATION Data exploration is the first step in data analysis and typically involves summarizing the main characteristics of a dataset. It is commonly conducted using visual analytics tools, but can also be done in more advanced statistical software, such as R.

8
IDE: I NTERACTIVE DATA EXPLORATION

9
AIDE: A UTOMATED INTERACTIVE DATA EXPLORATION An Automatic Interactive Data Exploration framework, that iteratively steers the user towards interesting areas and “predicts” a query that retrieves his objects of interest. AIDE integrates machine learning and data management techniques to provide effective data exploration results (matching user’s interest with high accuracy) as well as high interactive performance.
 as well as high interactive performance..")
10
W HAT IS MACHINE LEARNING ?

11
One definition: “Machine learning is the semi- automated extraction of knowledge from the data” Knowledge from data: Starts with a question that might be answerable using data Automated extraction: A computer provide the insights Semi-Automated: Requires many smart decisions by a human

12
T WO MAIN CATEGORIES OF MACHINE LEARNING Supervised learning: Making predictions using data Example: is a given email “spam” or “ham”? There is an outcome we are trying to predict Unsupervised learning: Extracting structure from data Example: Segment grocery store shoppers into clusters that exhibits similar behavior There is no “right answer”

13
S UPERVISED LEARNING High level steps of supervised learning: 1. First, train a machine learning model using labeled data “Labeled data” has been labeled with the outcome “Machine learning model” learns the relationship between the attributes of the data and its outcome 2. Then, make prediction on new data for which the label is unknown

14
S UPERVISED LEARNING The primary goal of supervised learning is to build a model that “generalizes”: It accurately predicts the future rather then the past!

15
S UPERVISED LEARNING The primary goal of supervised learning is to build a model that “generalizes”: It accurately predicts the future rather then the past! X1X2X3 Mail 1 “Hello..”291 Mail 2 “Dear…”173 Mail 3 “Check out..” 581

16
S UPERVISED LEARNING The primary goal of supervised learning is to build a model that “generalizes”: It accurately predicts the future rather then the past! Y Mail1Ham Mail2Spam Mail3Ham

17
S UPERVISED LEARNING The primary goal of supervised learning is to build a model that “generalizes”: It accurately predicts the future rather then the past!

18
D ECISION TREE CLASSIFIER

19
12 1 1.8 Y Y Y Y N N N N

20
D ECISION TREE CLASSIFIER 12 1 1.8 Y Y Y Y N N N N

21
D ECISION TREE CLASSIFIER 12 1 1.8 Y Y Y Y N N N N

22
H OW DECISION TREE REALLY WORKS ? Initial error: 0.2 After split: 0.5*0.4 + 0.5*0 = 0.2 Is this a good split? …. label 1 1 1 1 1 0 0 0 0 0

23
H OW DECISION TREE REALLY WORKS ? Selecting predicates - splitting criteria potential function val(.) to guide our selection: Every change is an improvement. We will be able to achieve this by using a strictly concave function. The potential is symmetric around 0.5, namely, val(q)= val(1 − q). When zero perfect classification. This implies that val(0) = val(1) = 0 We have val(0.5) = 0.5 val(T) ≥ error(T) Minimizing val(T) upper bounds the error!
 to guide our selection: Every change is an improvement. We will be able to achieve this by using a strictly concave function. The potential is symmetric around 0.5, namely, val(q)= val(1 − q). When zero perfect classification. This implies that val(0) = val(1) = 0 We have val(0.5) = 0.5 val(T) ≥ error(T) Minimizing val(T) upper bounds the error!.")
24
H OW DECISION TREE REALLY WORKS ? Splitting criteria: Gini Index: G(q) = 2q(1 − q) Before the split we have G(0.8)=2· 0.8· 0.2 = 0.32 After the split we have 0.5G(0.6) + 0.5G(1) = 0.5 · 2 · 0.4 · 0.6 = 0.24.
 = 2q(1 − q) Before the split we have G(0.8)=2· 0.8· 0.2 = 0.32 After the split we have 0.5G(0.6) + 0.5G(1) = 0.5 · 2 · 0.4 · 0.6 =")
25
C OMMENTS ON DECISION TREE METHOD Strength: Easy to use, understand Produce rules that are easy to interpret & implement Variable selection & reduction is automatic Do not require the assumptions of statistical models Can work without extensive handling of missing data Weakness: May not perform well where there is structure in the data that is not well captured by horizontal or vertical splits Since the process deals with one variable at a time, no way to capture interactions between variables Trees must be pruned to avoid over-fitting of the training data

26
U NSUPERVISED LEARNING High level steps of unsupervised learning: Also called clustering, sometimes called classification by statisticians and sorting by psychologists and segmentation by people in marketing 1. Organizing data into classes such that there is High intra-class similarity Low inter-class similarity between the attributes of the data and its outcome 2. Finding the class labels and the number of classes directly from the data (in contrast to classification). 3. More informally, finding natural groupings among objects.
. 3. More informally, finding natural groupings among objects..")
27
W HAT IS A NATURAL GROUPING AMONG THESE OBJECTS ?

28
C LUSTERING IS SUBJECTIVE School Employees Simpson's Family MalesFemales

29
W HAT IS SIMILARITY ? The quality or state of being similar; likeness; resemblance; as, a similarity of features. Webster's Dictionary Similarity is hard to define, but… “ We know it when we see it ” The real meaning of similarity is a philosophical question. We will take a more pragmatic approach.

30
D EFINING DISTANCE MEASURES Definition : Let O 1 and O 2 be two objects from the universe of possible objects. The distance (dissimilarity) between O 1 and O 2 is a real number denoted by D ( O 1, O 2 ) 0.23342.7 PeterPiotr 3
 between O 1 and O 2 is a real number denoted by D ( O 1, O 2 ) PeterPiotr 3.")
31
I NTUITION BEHIND DESIRABLE DISTANCE PROPERTIES 1. D(A,B) = D(B,A)Symmetry Otherwise you could claim “Alex looks more like Bob, than Bob does.” 2. D(A,B) = 0 IIf A=B Positivity (Separation) Otherwise there are objects in your world that are different, but you cannot tell apart. 3. D (A,B) D (A,C) + D (B,C) Triangular Inequality Otherwise you could claim “Alex is very like Bob, and Alex is very like Carl, but Bob is very unlike Carl.”
 = D(B,A)Symmetry Otherwise you could claim Alex looks more like Bob, than Bob does. 2. D(A,B) = 0 IIf A=B Positivity (Separation) Otherwise there are objects in your world that are different, but you cannot tell apart. 3. D (A,B) D (A,C) + D (B,C) Triangular Inequality Otherwise you could claim Alex is very like Bob, and Alex is very like Carl, but Bob is very unlike Carl. .")
32
A LGORITHM K- MEANS Goal: 1. Decide on a value for k 2. Initialize the k cluster centers (randomly, if necessary). 3. Decide the class memberships of the N objects by assigning them to the nearest cluster center. 4. Re-estimate the k cluster centers, by assuming the memberships found above are correct. 5. If none of the N objects changed membership in the last iteration, exit. Otherwise goto 3.
. 3. Decide the class memberships of the N objects by assigning them to the nearest cluster center. 4. Re-estimate the k cluster centers, by assuming the memberships found above are correct. 5. If none of the N objects changed membership in the last iteration, exit. Otherwise goto 3..")
33
K- MEANS CLUSTERING : S TEP 1 Algorithm: k-means, Distance Metric: Euclidean Distance 0 1 2 3 4 5 012345 k1k1 k2k2 k3k3

34
K- MEANS CLUSTERING : S TEP 2 Algorithm: k-means, Distance Metric: Euclidean Distance 0 1 2 3 4 5 012345 k1k1 k2k2 k3k3

35
K- MEANS CLUSTERING : S TEP 3 Algorithm: k-means, Distance Metric: Euclidean Distance 0 1 2 3 4 5 012345 k1k1 k2k2 k3k3

36
K- MEANS CLUSTERING : S TEP 4 Algorithm: k-means, Distance Metric: Euclidean Distance 0 1 2 3 4 5 012345 k1k1 k2k2 k3k3

37
K- MEANS CLUSTERING : S TEP 5 Algorithm: k-means, Distance Metric: Euclidean Distance k1k1 k2k2 k3k3

38
C OMMENTS ON THE K - MEANS METHOD Strength: Relatively efficient: O(tkn), where n is # objects, k is # clusters, and t is # iterations. Normally, k, t << n. Often terminates at a local optimum. The global optimum may be found using techniques such as: deterministic annealing and genetic algorithms Weakness: Applicable only when mean is defined, then what about categorical data? Need to specify k, the number of clusters, in advance Unable to handle noisy data and outliers Not suitable to discover clusters with non-convex shapes

39
M EASURE ACCURACY Precision is the fraction of retrieved instances that are relevant Recall is the fraction of relevant instances that are retrieved

40
M EASURE ACCURACY : F- SCORE

41
Q UESTION ABOUT MACHINE LEARNING How do I choose which attributes of my data to include in the model? How do I choose which model to use? How do I optimize this model for best performance? How do I ensure that I’m building a model that will generalize to unseen data? Can I estimate how well my model is likely to perform on unseen data?

42
B ACK TO AIDE…

43
H OW DOES AIDE WORKS ? Framework that automatically “steers” the user towards data areas relevant to his interest In AIDE, the user engages in a “conversation” with the system indicating his interests, while in the background the system automatically formulates and processes queries that collect data matching the user interest

44
AIDE FRAMEWORK Label data samples Decision Tree classifier Identify promising sampling areas Retrieve next sample set from DB

45
AIDE CHALLENGES AIDE operates on the unlabeled data space that the user aims to explore To achieve desirable interactive experience for the user, AIDE needs not only to provide accurate results, but also to minimize the number of samples presented to the user (which determines the amount of user effort). Trade-off between quality of results :accuracy and efficiency: the total exploration time which includes the total sample reviewing time and wait time by the user.

46
A SSUMPTIONS Predictions of linear patterns: user interest are captured by range queries Binary, non noisy, relevance system where the user indicates whether a data object is relevant or not to him and this categorization cannot be modified in the following iterations. Categorical, numerical features

47
D ATA CLASSIFICATION Decision tree classifier to identify linear patterns of user interest Decision tree advantages: Easy to interpret Perform well with large data Easy mapping to queries that retrieve the relevant data objects Can handle both numerical and categorical data

48
Q UERY FORMULATION Let us assume a decision tree classifier that predicts relevant and irrelevant clinical trials objects based on the attributes age and dosage

49
Q UERY FORMULATION SELECT * FROM table WHERE (age ≤ 20 and dosage >10 and dosage ≤ 15) or (age > 20 and age ≤ 40 and dosage ≥ 0 and dosage ≥ 10)).
 or (age > 20 and age ≤ 40 and dosage ≥ 0 and dosage ≥ 10)).")
50
S PACE EXPLORATION OVERVIEW focus is on optimizing the effectiveness of the exploration while minimizing the number of samples presented to the user goal is to discover relevant areas and formulate user queries that select either a single relevant area (conjunctive queries) or multiple ones (disjunctive queries). three exploration phases: Relevant Object Discovery Misclassified Exploitation Boundary Exploitation

51
P HASE ONE : RELEVANT OBJECT DISCOVERY Focus on collecting samples from yet unexplored areas and identifying single relevant object. This phase aims to discover relevant objects by showing to the user samples from diverse data areas To maximize the coverage of the exploration space it follows a well-structured approach that allows AIDE to: 1. ensure that the exploration space is explored widely 2. keep track of the already explored sub-areas 3. explore different data areas in different granularity

52
P HASE ONE : RELEVANT OBJECT DISCOVERY Attribute B Attribute A LEVEL 1LEVEL 2 0 120 80120 LEVEL 3 120

53
P HASE ONE : RELEVANT OBJECT DISCOVERY

54
Optimizations: Hint-based object discovery : specific attributes ranges on which the user desires to focus Skewed attributes : use K-means algorithm to partition the data space into k clusters. Data base objects are assigned to the cluster with the closest centroid

55
P HASE TWO : MISCLASSIFIED EXPLOITATION Goal is to discover relevant areas as opposed to single object. This phase strategically increase the relevant object in the training set such that the predicted queries will select relevant areas Designed to increase both the precision and recall of the final query. Strive to limit the number of extraction queries and hence the time overhead of this phase

56
P HASE TWO : MISCLASSIFIED EXPLOITATION Generation of Misclassified Samples : Assuming decision tree classifier Ci is generated on i-th iteration. This phase leverages the misclassified samples to identify the next set of sampling areas in order to discover more relevant areas. addresses the lack of relevant samples by collecting more objects around false negatives.

57
P HASE TWO : MISCLASSIFIED EXPLOITATION

58
Clustering-based Exploitation Algorithm : create clusters using the k- means algorithm and have one sampling area per cluster sample around each cluster In each iteration i, the algorithm sets k to be the overall number of relevant objects discovered in the object discovery phase. we run the clustering based exploitation only if k is less than the number of false negatives experimental results showed that f should be set to a small number (10-25 samples)
.")
59
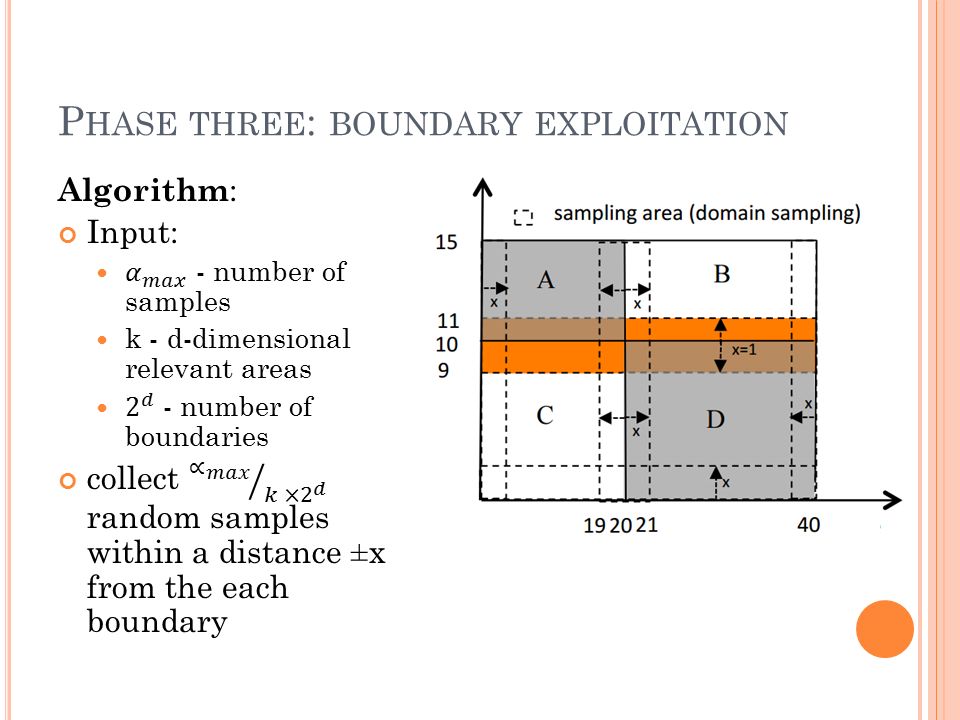
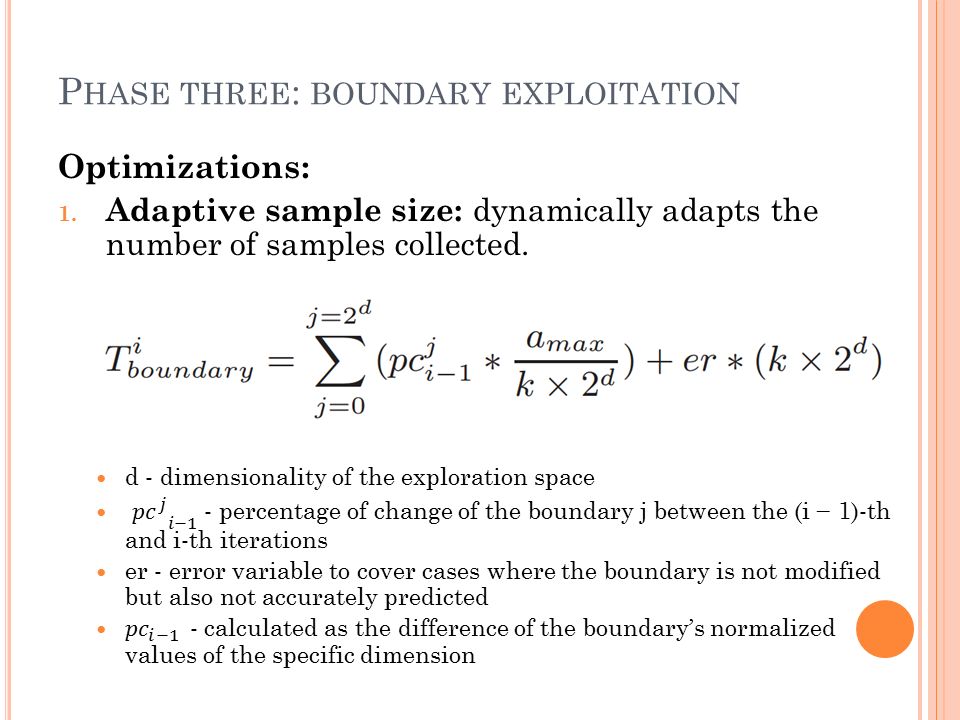
P HASE THREE : BOUNDARY EXPLOITATION

63
Optimizations: 2. Non-overlapping Sampling Areas : In this case, the exploration areas do not evolve significantly between iterations, resulting in redundant sampling and increased exploration cost (e.g., user effort) without improvements on classification accuracy
 without improvements on classification accuracy.")
64
P HASE THREE : BOUNDARY EXPLOITATION Optimizations: 3. Identifying Irrelevant Attributes : domain sampling around the boundaries. While shrinking/expanding one dimension of a relevant area, collect random samples over the whole domain of the remaining dimensions

65
P HASE THREE : BOUNDARY EXPLOITATION Optimizations: 4. Exploration on Sampled Datasets: generate a random sampled database and extract our samples from the smaller sampled dataset this optimization can be used for both the misclassified and the boundary exploitation phases generate sampled data sets using a simple random sampling approach that picks each tuple with the same probability

66
AIDE MODEL SUMMARY Initial Sample Acquisition The iterative steering process starts when the user provides his feedback: Data Classification domain experts could restrict the attribute set on which the exploration is performed Data Extraction Query Space Exploration Relevant Object Discovery Misclassified Exploitation Boundary Exploitation Sample Extraction Query Formulation

67
C ONCLUSIONS AIDE assists users in discovering new interesting data patterns and eliminate expensive ad-hoc exploratory queries AIDE relies on a seamless integration of classification algorithms and data management optimization techniques that collectively strive to accurately learn the user interests based on his relevance feedback on strategically collected samples Our techniques minimize the number of samples presented to the user (which determines the amount of user effort) as well as the cost of sample acquisition (which amounts to the user wait time) It provides interactive performance as it limits the user wait time per iteration of exploration to less than a few seconds.
 as well as the cost of sample acquisition (which amounts to the user wait time) It provides interactive performance as it limits the user wait time per iteration of exploration to less than a few seconds.")
68
A NY Q UESTIONS ?

69
A ND NOW FOR REAL.. https://www.youtube.com/watch?v=1BwIw_t_J_4

Similar presentations
 Johannes Gehrke>")


>")


 Vipin Kumar Army High Performance.>")


