Download presentation
Presentation is loading. Please wait.

1
Syllabus

2
To make a standard solution, A take a weighing bottle and place on B a balance, and weigh to 2.d.p. Then transfer solid from bottle to volumetric flask D the reweigh the bottle. Rinse solid into flask with distilled water (E) and make up to the mark to create standard solution F (known mass in known volume). Making a standard solution
 and make up to the mark to create standard solution F (known mass in known volume). Making a standard solution.")
3
Below is the model answer for how to make a standard solution; A – place a weighing bottle on a weighing balance 2 d.p B – weigh the sample to 2 d.p volumetric flask funnel C – transfer the solid to the volumetric flask with the aid of a funnel D – reweigh the bottle (the difference in mass is what is in the flask) rinsefunneldistilled water E – rinse any solid on the funnel into the flask using distilled water make up to the mark distilled water shake (invert) dissolved F – make up to the mark with the distilled water and shake (invert) to make sure all solid has dissolved Making a standard solution
 rinsefunneldistilled water E – rinse any solid on the funnel into the flask using distilled water make up to the mark distilled water shake (invert) dissolved F – make up to the mark with the distilled water and shake (invert) to make sure all solid has dissolved Making a standard solution")
4
Past paper questions

6
methyl orange strong acid weak base phenolphtaleinstrong base weak acid Titrations are done to find the concentration of an unknown solution. pipette 25cm 3 of your standard solution into a conical flask. Add 3 drops of an indicator (methyl orange for strong acid with weak base, or phenolphtalein for strong base and weak acid). Add unknown solution to burette and take a reading (0.05cm 3 ). Add unknown to standard solution whilst swirling until there is a permanent colour change. Titrations
. Add unknown solution to burette and take a reading (0.05cm 3 ). Add unknown to standard solution whilst swirling until there is a permanent colour change. Titrations.")
7
Pipetteconical flask Pipette 25cm 3 of acid or alkali (read the exam question) into a conical flask. 3 dropsindicator. add 3 drops of indicator. burettetake a reading to the nearest 0.05 cm 3. Pour acid or alkali (read the exam question) into a burette and take a reading to the nearest 0.05 cm 3. buretteconical flask swirlingpermanent colour change. Add the acid or alkali from the burette to the conical flask whilst swirling until there is a permanent colour change. Take a readingburetteto the nearest 0.05 cm 3. Take a reading from the burette to the nearest 0.05 cm 3. Repeat Repeat the above steps until 3 concordant (within 0.1/0.2 cm 3 ) results are achieved. How to perform a titration – model answer
 into a burette and take a reading to the nearest 0.05 cm 3. buretteconical flask swirlingpermanent colour change. Add the acid or alkali from the burette to the conical flask whilst swirling until there is a permanent colour change. Take a readingburetteto the nearest 0.05 cm 3. Take a reading from the burette to the nearest 0.05 cm 3. Repeat Repeat the above steps until 3 concordant (within 0.1/0.2 cm 3 ) results are achieved. How to perform a titration – model answer.")
8
Past paper questions

10
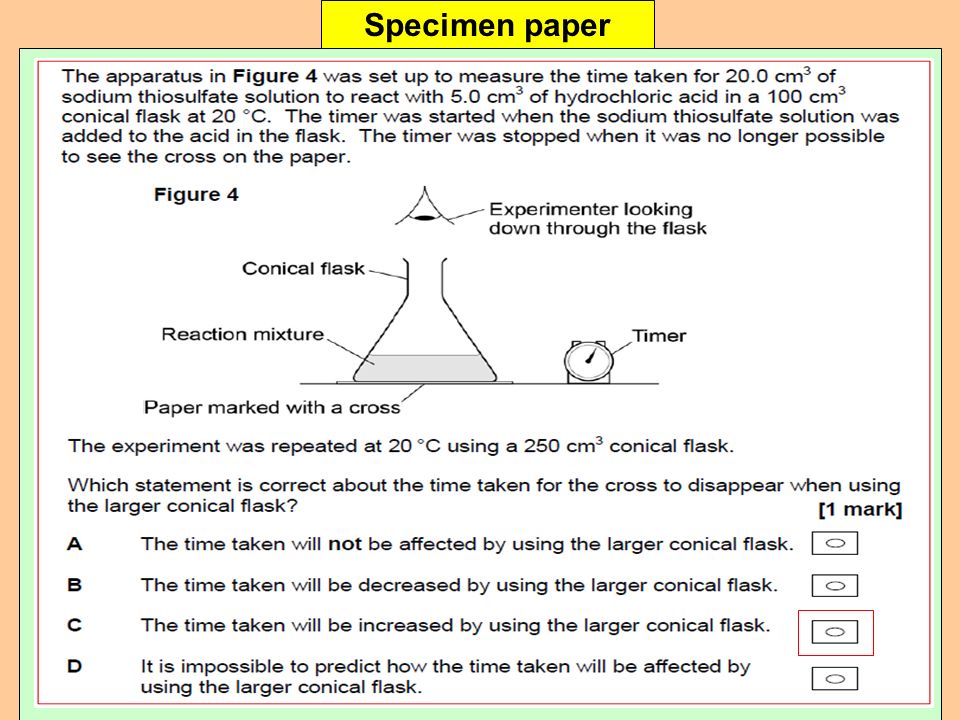
Specimen paper

11
Measurements and errors Accuracy - A measure of the closeness of agreement between an individual result and the accepted value. An accurate result is in close agreement with the accepted value. Error - The difference between an individual measurement and the true value (or accepted reference value) of the quantity being measured. Precision - The closeness of agreement between independent measurements obtained under the same conditions. It depends only on the distribution of random errors (i.e. the spread of measurements) and does not relate to the true value. Uncertainty - An estimate attached to a measurement which characterises the range of values within which the true value is said to lie. It is written, for example, as 44.0 ± 0.4. Reliability - The opposite of uncertainty; high uncertainty = not very reliable measurement
 of the quantity being measured. Precision - The closeness of agreement between independent measurements obtained under the same conditions. It depends only on the distribution of random errors (i.e. the spread of measurements) and does not relate to the true value. Uncertainty - An estimate attached to a measurement which characterises the range of values within which the true value is said to lie. It is written, for example, as 44.0 ± 0.4. Reliability - The opposite of uncertainty; high uncertainty = not very reliable measurement.")
12
Measurements and errors Accuracy of measurements Uncertainty is often taken to be half a division on either side of the smallest unit on the scale. However, the accuracy of measurements also depends on the quality of the apparatus used (e.g. Grade A or Grade B glassware.) example If a 100 cm 3 measuring cylinder is graduated in 1 cm 3 divisions. Class A - maximum error of half a division (0.5 cm 3 ) Class B - maximum error of a whole division (1 cm 3 ) Glassware - When glassware is manufactured there will always be a maximum error. This is usually marked on the glassware. Temperature - Volumetric equipment must not get warm because expansion of the glass will alter the volume; the temperature is marked on the apparatus
 example If a 100 cm 3 measuring cylinder is graduated in 1 cm 3 divisions. Class A - maximum error of half a division (0.5 cm 3 ) Class B - maximum error of a whole division (1 cm 3 ) Glassware - When glassware is manufactured there will always be a maximum error. This is usually marked on the glassware. Temperature - Volumetric equipment must not get warm because expansion of the glass will alter the volume; the temperature is marked on the apparatus.")
13
Measurements and errors

14
Maximum errors - Burettes are graduated in divisions every 0.1 cm 3 Therefore the maximum error is half a division i.e. ± 0.05 cm 3 burettes are read twice, so the overall maximum error is 2 x 0.05 = ± 0.1 cm 3 Pipettes - a 25 cm 3 pipette has a maximum error of 0.05 cm 3 like all volumetric equipment it must be used properly. The significance of the maximum error in a measurement depends upon how large a quantity is being measured. It is useful to quote this error as a percentage error.

15
Measurements and errors The percentage error The percentage error in a measurement is based on two factors - maximum error and value of measurement. The percentage error The percentage error in a measurement is calculated in the following manner; percentage error = maximum error x 100% value of measurement value of measurement the smaller the value measured, the greater the percentage error

16
Past paper questions

19
Calorimetryenthalphy change Calorimetry is used to measure the enthalphy change for a reaction. The apparatus on the left is used to measure enthalphy’s of combustion. The one on the right is used when two solutions are mixed, or when a solid is placed in a solution eg a metal added to an acid. Calorimetry

20
Note - the experiments in the box below right could all be examined

21
temperature average kinetic energy The thermometer is placed in a beaker of water /solution. The reaction then heats the water or solution. The energy released from the reaction then passes to the molecules in the water/solution. There fore the amount of water/solution is important. The more water/solution molecules there are for a set amount of energy released, the less energy each molecule will gain. Since temperature is a measure of the average kinetic energy of the molecules we will see less of a temperature increase. The energy required to change the temperature of a substance can be calculated using; q = m x c x ΔT where q = heat energy (J) m = mass (g) c = Specific Heat Capacity (J K -1 g -1 ) [ water is 4.18 ] Δ T = change in temperature (K) Calorimetry
 m = mass (g) c = Specific Heat Capacity (J K -1 g -1 ) [ water is 4.18 ] Δ T = change in temperature (K) Calorimetry.")
22
density1g cm -3 volume of water/solution mass,. calculate the mass of the oil by multiplying its density by its volume From the previous slide note; Note - the density of water is 1g cm -3 therefore in any calculation the volume of water/solution that is heated, is the same as the mass, as long as water is being used. If the temperature was expected to go above a 100 0 C then you might use oil (hexane or the like), in which case you would calculate the mass of the oil by multiplying its density by its volume. Note the heat capacity value will also be different, obviously densityheat capacity of water Note - in calculations involving solutions, the density and heat capacity of water are used as a simplification. This therefore introduces a small amount of error into measurements carried out in this fashion. Calorimetry
, in which case you would calculate the mass of the oil by multiplying its density by its volume. Note the heat capacity value will also be different, obviously densityheat capacity of water Note - in calculations involving solutions, the density and heat capacity of water are used as a simplification. This therefore introduces a small amount of error into measurements carried out in this fashion. Calorimetry.")
23
Specimen paper

25
graphical method to measure the enthalpy change The maximum temperature change can then be found from the graph next slide. If the enthalpy of reaction of a metal with a solution of a metal containing compound wanted to be measured, or the enthalpy of reaction of an acid with an alkali wanted to be measured, then one could carry out the reaction in a polystyrene cup. The temperature change of the solution could then be measured with a thermometer, and the enthalpy change for the reaction could be calculated as it was in the previous slides. However if the reaction is quite slow then some of the heat evolved in a reaction will be lost to the surrounding whilst the reaction still continues. In other words the maximum ΔT is never recorded, hence our calculation will be incorrect. The way around this is to use a graphical method to measure the enthalpy change. Carry out the experiment in the polystyrene cup in the usual way, only instead of measuring the starting temperature and the highest temperature reached during the reaction, measure the temperature every minute. Then plot the points on a graph. The maximum temperature change can then be found from the graph shown on the next slide. Calorimetry

26
Draw a line of best fit through points for the fall in temperature so you can extrapolate back to the 4 min mark. Reagents are mixed after 4 mins. ΔTΔT Calorimetry

27
Specimen paper

28
temperaturegas The apparatus below could be used to see how changing the temperature affects the rate of a reaction if a gas is given off. Measuring the rate of reaction - temperature

29
An alternative way of collecting the gas is the collecting over water method shown below. Ways of following a chemical reaction

30
solutions products of the reaction is a solid timing seenprecipitate (solid) water bathchanging the temperature If the reactants are solutions and one of the products of the reaction is a solid (precipitate ppt), then timing how long it takes until a cross on a piece of paper can no longer be seen because of the precipitate (solid) can be used. The conical flask could have been put into a beaker of hot water (a water bath) if you want to investigate how changing the temperature affects the rate of reaction.
 if you want to investigate how changing the temperature affects the rate of reaction..")
31
Specimen paper

33
Distillation apparatus distillation apparatus At the end of a reaction in a reflux apparatus, you will have a mixture of compounds. To separate this mixture you can use the distillation apparatus below.

34
Distillation apparatus diagramartistic picture. Sometimes you can can get asked to to draw a diagram of a distilation apparatus/reflux/condenser. If you do it’s a diagram not an artistic picture. So it is important to show that the apparatus is open from the flask through the condenser to the test tube (see red line on diagram). Compare ‘diagram’ below with the “picture” on the previous slide.
. Compare ‘diagram’ below with the picture on the previous slide..")
35
Distillation apparatus Anti bumping granules During boiling, the bubbles of vapour form around rough areas. If a liquid is boiled in very clean, smooth glassware it can be difficult for bubbles of vapour to form. Suddenly, one large bubble of vapour forms disturbing the boiling liquid violently. This effect is known as bumping, and is hazardous. Anti bumping granules are small ceramic granules which have rough edges. A few are added to a liquid before heating and they encourage smooth boiling. Four or five granules is enough to work well - students often add ten times this amount!

36
Past paper questions

37
Specimen

38
Test tube reactions – inorganic ions organicinorganic ions simple test tube reactions To identify unknown organic compounds or unknown inorganic ions (sulphates etc), simple test tube reactions can be performed. ammonium dampred litmus paper ammonia damp Testing for ammonium ions - Add sodium hydroxide solution and test the gas given off using damp red litmus paper – the gas is ammonia and it turns damp red litmus paper blue.

39
Test tube reactions – inorganic ions carbonateacid (nitric/hydrochloric acid) carbon dioxide gaslimewater milky. Testing for carbonate ions - Add any named acid (nitric/hydrochloric acid) to the suspected carbonate, if carbonate ions are present, carbon dioxide gas will be produced that turns limewater milky.
 to the suspected carbonate, if carbonate ions are present, carbon dioxide gas will be produced that turns limewater milky..")
40
Test tube reactions – inorganic ions group 2 metal soluble sulphate compounds soluble hydroxide compounds white ppt For this course you also have to know the test for group 2 metals and the halides. These tests can all be found in the periodic table ppt. to test for a group 2 metal you can add soluble sulphate compounds (Na 2 SO 4 ) or soluble hydroxide compounds (NaOH). The bottom of group 2 St/Ba will give a white ppt with sulphates and be soluble with hydroxides. top of group 2 Mg/Ca white ppt The top of group 2 Mg/Ca will give a white ppt with hydroxide ions and be soluble with sulphate ions (Ca is insoluble in both depending on concentration) sulphatesoluble barium compound white ppt BaSO 4 The test for a sulphate ion is to add a soluble barium compound (BaCl 2 /Ba(NO 3 ) 2 ) this will produce a white ppt of BaSO 4 halideacidified silver nitrate Concentrated sulphuric acid more reactive halogen There are many test for halide ions. Adding acidified silver nitrate solution. Concentrated sulphuric acid to a halide salt. Adding a more reactive halogen to a solution of a less reactive halide ion (see periodic table ppt for details). hydroxideindicator blue/purplesoluble magnesium compound white ppt magnesium hydroxide. To test for a hydroxide ion you could use an indicator eg UI which will turn blue/purple. Or you could add a soluble magnesium compound to get a white ppt of magnesium hydroxide.
 or soluble hydroxide compounds (NaOH). The bottom of group 2 St/Ba will give a white ppt with sulphates and be soluble with hydroxides. top of group 2 Mg/Ca white ppt The top of group 2 Mg/Ca will give a white ppt with hydroxide ions and be soluble with sulphate ions (Ca is insoluble in both depending on concentration) sulphatesoluble barium compound white ppt BaSO 4 The test for a sulphate ion is to add a soluble barium compound (BaCl 2 /Ba(NO 3 ) 2 ) this will produce a white ppt of BaSO 4 halideacidified silver nitrate Concentrated sulphuric acid more reactive halogen There are many test for halide ions. Adding acidified silver nitrate solution. Concentrated sulphuric acid to a halide salt. Adding a more reactive halogen to a solution of a less reactive halide ion (see periodic table ppt for details). hydroxideindicator blue/purplesoluble magnesium compound white ppt magnesium hydroxide. To test for a hydroxide ion you could use an indicator eg UI which will turn blue/purple. Or you could add a soluble magnesium compound to get a white ppt of magnesium hydroxide..")
41
Specimen paper

42
Jun 2011

44
Test tube reactions – organic functional groups – add bromine water shake. brown to colourless. Testing for an alkene – add bromine water to suspected alkene and shake. If alkene present solution will turn from brown to colourless.

45
Specimen paper

48
Test tube reactions – organic functional groups – either ammoniacal silver nitrate solution (tollens reagent), fehlings solutionwarm tollens reagent gives a silver mirrorblue fehlings solution reddish/brown ppt Testing for an aldehyde – to a test tube with the suspected aldehyde, add either ammoniacal silver nitrate solution (tollens reagent), or fehlings solution and warm in a water bath. If an aldehyde is present tollens reagent gives a silver mirror (left picture) and blue fehlings solution will give a reddish/brown ppt (right picture).
 and blue fehlings solution will give a reddish/brown ppt (right picture)..")
49
Past paper questions

50
Specimen paper

51
Test tube reactions – organic functional groups – add a metal carbonate to the suspected carboxylic acid, carbon dioxide gas.limewater. cloudy /milky. note - this is the test for carbonate ions as well. Testing for a carboxylic acid – add a metal carbonate to the suspected carboxylic acid, such as calcium carbonate, to produce carbon dioxide gas. Bubble the CO 2 through limewater. The limewater will turn cloudy /milky. note - this is the test for carbonate ions as well.

52
Test tube reactions – organic functional groups – warmingacidified potassium dichromate. Testing for an alcohol – there are many tests for alcohols, but the most common one on this course, is warming with acidified potassium dichromate. primary secondary, acidified potassium dichromate orange green If the alcohol is primary or secondary, the acidified potassium dichromate will turn from orange to green.

53
Past paper questions

55
Test tube reactions – organic functional groups – tertiary alcohol, solid PCl 5 white Testing for an alcohol – To test for a tertiary alcohol, or any alcohol you can add solid PCl 5 to the alcohol. If steamy white acidic (turns damp blue litmus red) fumes (HCl) are produced, then an OH group is present. Note - a carboxylic acid will also give a positive result with this test as it contains an OH group. Alcohols would not react with carbonate ions, and carboxylic acids cannot be oxidised, so would give no colour change with acidified potassium dichromate.
 fumes (HCl) are produced, then an OH group is present. Note - a carboxylic acid will also give a positive result with this test as it contains an OH group. Alcohols would not react with carbonate ions, and carboxylic acids cannot be oxidised, so would give no colour change with acidified potassium dichromate..")
56
Revision ppt Explain Explain how to make a volumetric solution Explain how to perform a titration Spot errors Spot errors in technique for above 2 prossesses Spot flaws Spot flaws in calorimetry expts Explain/Spot errors Explain/Spot errors in technique for rates expt (temperature) Distilation – draw/label apparatus – purpose of anti-bumping granules Explain test Explain test for inorganic ions ammonium/hydroxide/carbonate/halide and group 2 ions Explain functional group tests Explain functional group tests for carboxylic acid/alkene/alcohol and aldehyde
 Distilation – draw/label apparatus – purpose of anti-bumping granules Explain test Explain test for inorganic ions ammonium/hydroxide/carbonate/halide and group 2 ions Explain functional group tests Explain functional group tests for carboxylic acid/alkene/alcohol and aldehyde")
57
but are not essential to know for passing your AS exam. The following slides show other important practical techniques which are used in chemistry, but are not essential to know for passing your AS exam.

58
A fractional distillation column

59
Reflux apparatus

60
A reflux apparatus with a calcium chloride drying tube

61
The separating funnel

62
Filtration under reduced pressure using a buchner funnel The fast flowing water from the tap “removes” some of the oxygen from beneath the filter funnel, thus there is greater pressure from the atmosphere above the filter paper than beneath the filter paper, thus the solution is forced through the paper much quicker than if we were just relying on gravity to pull it through.

63
Filtration under reduced pressure using a buchner funnel

64
Melting point apparatus The melting point of a liquid can be determined using the method below. By looking through a magnifying glass window, you can see both the small sample and the thermometer. If the sample is pure, all the sample will melt at a precise temperature. If it is not pure, it will melt over a range of temperatures and will therefore need to be recrystallized.

65
Boiling point determination The boiling point of a liquid can be determined using the method below

67
A liquid vapour composition graph

68
Explaining how fractional distillation works In an exam you will be asked to sketch a vapour/liquid composition graph and use it to explain how the process of fractional distillation works. The graph should show boiling points and composition axis (1) the boiling points the correct way round relative to the composition axis (1) vap/liq lines reasonably drawn (1) the lines labelled liq/vap respectively (1) A model answer explaining how the process works using the diagram would have tie lines shown on diagram (1) state vapour is richer in the component with the lower boiling point (more volatile liquid) (1) uses tie lines with labels to explain how repeated distillations would work eg if you have a liquid of composition C1 and you heat it to its B.p the vapour will have composition C2 which is richer in component with the lower boiling point, if we redistill this mixture we will have a vapour which has composition C3 which is richer still in the component with the lower boiling point) (1) this process is repeated until the component with highest boiling point is left in flask (1)
 the boiling points the correct way round relative to the composition axis (1) vap/liq lines reasonably drawn (1) the lines labelled liq/vap respectively (1) A model answer explaining how the process works using the diagram would have tie lines shown on diagram (1) state vapour is richer in the component with the lower boiling point (more volatile liquid) (1) uses tie lines with labels to explain how repeated distillations would work eg if you have a liquid of composition C1 and you heat it to its B.p the vapour will have composition C2 which is richer in component with the lower boiling point, if we redistill this mixture we will have a vapour which has composition C3 which is richer still in the component with the lower boiling point) (1) this process is repeated until the component with highest boiling point is left in flask (1).")
69
poorly at room tempdissolves in well at the solvents boiling pointminimumhot solvent using a pre-heated funnel (to cool then refilter reduced pressure minimum of cold solvent Model answer for recrystalisation - first find a solvent that your solid dissolves in very poorly at room temp but dissolves in well at the solvents boiling point (1). Dissolve solid in minimum of hot solvent (1). Filter the mixture using a pre-heated funnel (1). Allow filtrate to cool then refilter using a buchner funnel under reduced pressure (1). Wash solid in minimum of cold solvent on the filter paper (1) 5 marks in total Recrystalisation
. Filter the mixture using a pre-heated funnel (1). Allow filtrate to cool then refilter using a buchner funnel under reduced pressure (1). Wash solid in minimum of cold solvent on the filter paper (1) 5 marks in total Recrystalisation.")
70
The diagram shows you how to flute filter paper to increase the surface area so if filters faster. Fluted filter paper

Similar presentations


 exchanged for halogen atom(s).>")


 replaces one or more hydrogen ions of an acid. HClNaCl.>")
