Download presentation
Presentation is loading. Please wait.

1
Time-Cost Trade-off Models
Develops the relationship between direct costs, indirect costs, and time to complete the project by minimizing the sum of direct and indirect costs. Crash – shortening activity duration Crash Costs Additional costs of an activity when time to complete it is shortened. Crashing costs increase as project duration decreases Indirect costs increase as project duration increases

2
Time-Cost Tradeoff Minimum cost = optimal project time Total cost
Indirect cost Direct cost Crashing Time Project Duration

3
Minimum-Cost Scheduling
Step 1: Prepare the network diagram. a. Normal cost (NC) b. Normal time (NT) c. Crash time (CT) d. Crash Cost (CC) Step 2: Determine cost per unit of time to crash each activity. Step 3: Compute the critical path. Step 4: Shorten the critical path at the least cost.
 b. Normal time (NT) c. Crash time (CT) d. Crash Cost (CC) Step 2: Determine cost per unit of time to crash each activity. Step 3: Compute the critical path. Step 4: Shorten the critical path at the least cost.")
4
Time-cost Trade-offs: Crashing
Procedure for crashing Crash the project one period at a time Only an activity on the critical path Crash the least expensive activity Multiple critical paths: find the sum of crashing the least expensive activity on each critical path

5
Activity Graph

6
Project Crashing Crashing is reducing project time by expending additional resources Crash time is an amount of time an activity is reduced Crash cost is the cost of reducing the activity time Goal is to reduce project duration at minimum cost

7
Project Crashing Crashing a project involves paying more money to complete a project more quickly. Since the critical path determines the length of a project, it makes sense to reduce the length of activities on the critical path. CP activities should be reduced until the project is reduced to the desired length or you are paying more per day than you save..

8
Cost-Time Trade-Off Example

9
Cost-Time Trade-Off Example (continued)
")
11
Project Cost-Time Graph

13
Calculation of Cost/Day to Accelerate Each Activity

14
Reducing Project Completion Time One Day at a Time

15
Plot of Costs and Minimum Cost Schedule

16
House-building Network
Activity times in weeks 3 8 12 4 1 2 4 6 7 12 4 4 4 5

17
Normal Activity And Crash Data
Total Normal Crash Allowable Crash Time Time Normal Crash Crash Time Cost per Activity (wks) (wks) Cost Cost (wks) Week $3,000 $5,000 5 $400 ,000 3, ,000 7, ,000 , ,000 71, ,000 , ,000 22, ,000 $75,000 $110,700
 (wks) Cost Cost (wks) Week $3,000 $5,000 5 $ ,000 3, ,000 7, , , ,000 71, , , ,000 22, ,000. $75,000 $110,700.")
18
Network With Crashing Costs
Activity 1-2 can be crashed a total of 5 weeks for $2000 Crash cost per week = Total crash cost/Total crash time = $2,000/5 = $400 per week 3 $500 8 $7,000 12 4 $7,000 1 2 4 6 7 $400 $3,000 12 4 4 4 $200 $200 5

19
Crashing Solution Normal Crash Crash Crash Crashing
Time Time Time Cost per Cost Activity (wks) (wks) Used Week Incurred $400 $2,000 ,500 ,000 0 ,000 21,000 ,000 7,000 12 $31,500
 (wks) Used Week Incurred $400 $2, , , ,000 21, ,000 7, $31,500.")
20
Crashed Project 1 2 4 6 7 3 5 Original time Crashed times

21
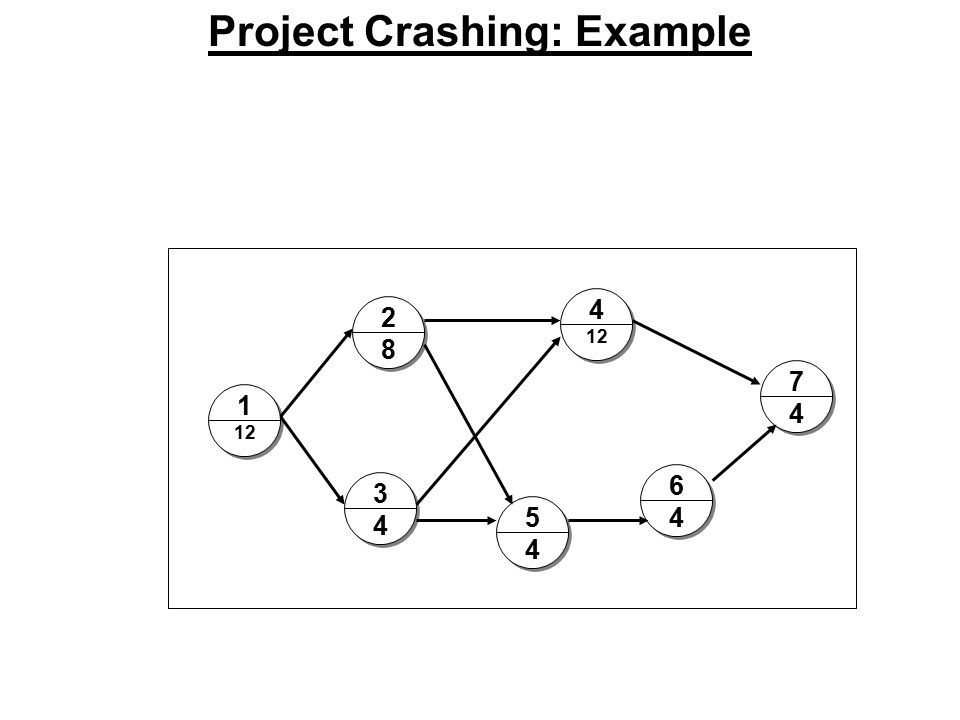
Project Crashing: Example
1 12 2 8 4 3 5 6 7
22
Normal Activity and Crash Data
TOTAL NORMAL CRASH ALLOWABLE CRASH TIME TIME NORMAL CRASH CRASH TIME COST PER ACTIVITY (WEEKS) (WEEKS) COST COST (WEEKS) WEEK $3,000 $5,000 5 $400 ,000 3, ,000 7, ,000 ,000 71, ,000 , , ,000 22, ,000 $75, $110,700
 (WEEKS) COST COST (WEEKS) WEEK $3,000 $5,000 5 $ ,000 3, ,000 7, , ,000 71, , , , ,000 22, ,000. $75,000 $110,700.")
23
FROM … TO… Project Duration: 36 weeks Project Duration: 31 weeks
$7000 $500 Project Duration: 36 weeks 12 4 2 8 $700 7 4 1 12 FROM … 6 4 $400 3 4 5 4 $200 $3000 $200 1 7 2 8 3 4 5 6 $400 $500 $3000 $7000 $200 $700 12 TO… Project Duration: 31 weeks Additional Cost: $2000

Similar presentations


