Download presentation
Presentation is loading. Please wait.

1
Atlantic Coast Operations Business Intelligence Mobility Project

2
Overview BI Tools Overview and Recommendation Key Metrics and Information Model Key Messages regarding Mobile Spend Dashboard Presentation Implementation Approach

3
ACO’s Vision for BI A tool that is simple for users to learn, that has the ability to create reports that are easy to interpret by management and fulfill all the functional requirements needed. These are: Self-Service Platform Ability to Forecast and perform Predictive Analysis Access Reports and Dashboards on Mobile Devices View data geospatially on reports via maps

4
Overview of Current Tools Limited Advanced Analytics features in Cognos TM1 can forecast budgets, although not currently available company wide Tableau has great visual analytics, but generally not powerful and also not available company wide. Even when combined, these tools do not currently meet ACO’s vision for the future of business intelligence. No option for Mobile Platform

5
Recommendations Full stack Business Intelligence solution Ability to process large data without expensive back-end hardware or intense IT support Create dynamic, mobile-accessible dashboards easily without a technical background Ability to forecast and perform other predictive analysis based on one or more large historical data sets Ability to visualize data geographically

6
Comparison to Traditional BI (i.e. Cognos)
")
7
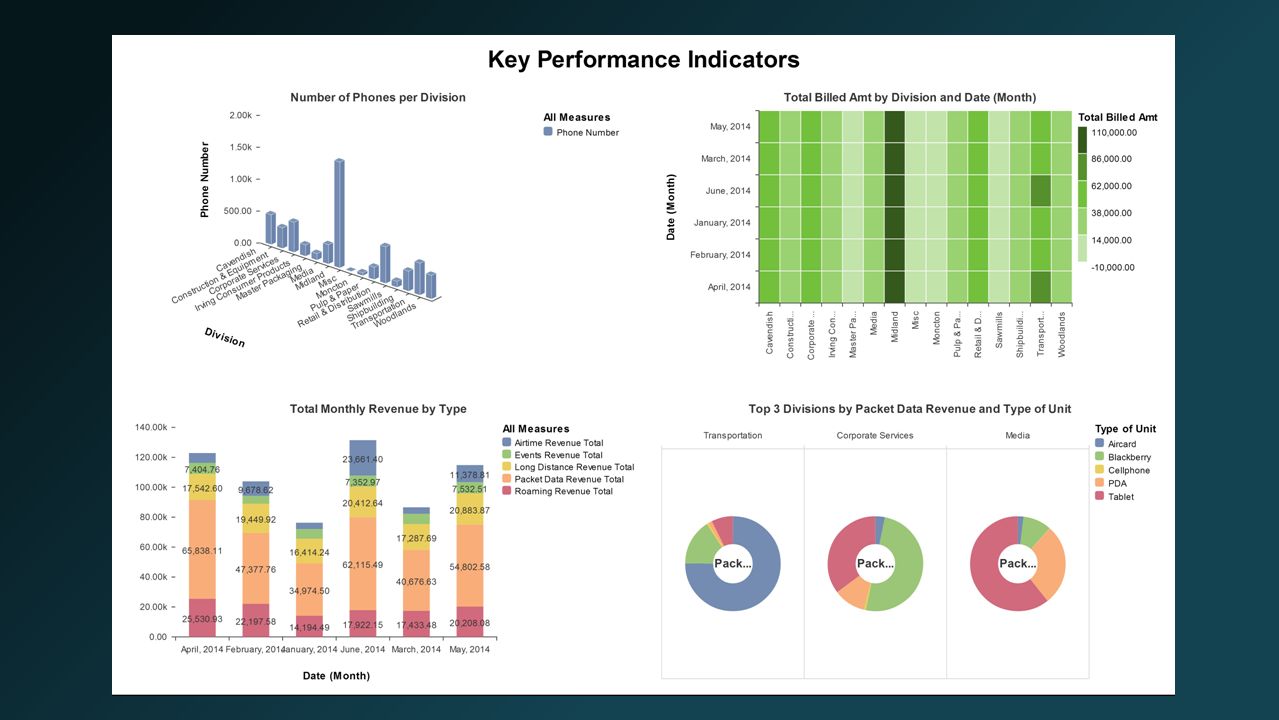
Key Metrics MetricDescriptionRationale Total Billed Amount The total amount billed to ACO for mobile spend Analyzing this metric by division or month allows us to narrow down segments or time periods within the corporation whose usage is irregular, or greater than average. Airtime Revenue Total The total amount of expenditure for airtime This is a useful metric for determining which divisions or model types are being used the most for calling, either during peak hours, evenings or weekends. Events Revenue Total The total amount of expenditure for special events This is useful for determining the amount of events being accumulated by the company, aside from regular usage such as calling, texting, etc. Long Distance Revenue Total The total amount of expenditure for long distance calling Long distance revenue can determine which divisions are travelling the most, and how much it is costing to use their mobile devices while outside of their area. Packet Data Revenue Total The total amount of expenditure for packet data usage Packet data allows us to view how much internet is being used on mobile devices. This can help us determine whether or not it is necessary, and if there is other plans with better data usage options. Roaming Revenue Total The total amount of expenditure for roaming charges Roaming revenue is similar to long distance, as it shows us how much spending is done outside of our provider’s network. This can be analyzed by division, or by month, to determine who is travelling outside of our network and when the most travelling occurs.

8
Star Schema Information Model Dimension tables, with primary keys to connect to the measure fact table, based on: Date Time Phone Data Plan Divison Base Price Plan These dimensions are used to describe the measures within the fact table

9
Star Schema Information Model Fact Table consisting of measures Measures are primarily numerical, additive attributes that are analyzed and used for decision making This table also contains copies of the primary keys connected to each dimension table

10
Star Schema Information Model Final design when put together Model used to create data marts within the data warehouse These tables, in the data mart are used to create reports and dashboards using BI solutions

11
Message #1: Evening and Weekends High amount of weekend and evening charges Non 24/7 operating divisions will provide track of when phone usage is occurring From Jan, 2014-June,2014 average of 24.9 evening duration hours Been charged an extra $603.18 for evening charges. Moncton has the highest total evening charges

12
Message #1: Evening and Weekend From Jan, 2014- June, 2014 had on average 37.7 weekend duration hours Spent an extra $2,756.09 on weekend calls The media division spent the most on weekend charges To cut mobile spend divisions and companies of the companies that don’t operate 24/7 should provide data on where the evening and weekend duration is occurring For the divisions and companies that operate 24/7 it is beneficial to find a mobility plan that reduces costs on evening and weekends

13
Message #2: Roaming Roaming charges occur when the mobile device is out of the country the mobile provider is in ACO does business throughout Canada and the US Heat map should be created to view where the roaming charges are coming from. Must look at which divisions, companies and mobile devices are being charged the most for roaming Midland, Transportation, Corporate Services and Cavendish Must find a mobile plan that has roaming feature.

14
Message #3: Peak Hours Peak hours refers to the timeframe where mobile charges are at the highest (8 AM – 5PM) This timeframe is where they should be at their desks and have access to landline Positive correlation between peak hours duration and peak hours charges in June, 2014 Being charged on average $9.43 per peak hour
 This timeframe is where they should be at their desks and have access to landline Positive correlation between peak hours duration and peak hours charges in June, 2014 Being charged on average $9.43 per peak hour")
15
Message #2: Peak Hours Significant increase in peak hour between April and June Could be because it is the busiest time of the year. IT should analyze why peak hours duration and charges are higher during those months Management should try and understand why mobile devices are being used instead of landline Midland being the highest due to being a transportation company

16
Message #4: Monthly Features Easiest way to reduce costs Analyze data to find optimal price and feature plans Divisions that do business in the US may need different features. Find what employees need what price and feature plans Sum Of Price Plan & Features

19
Implementation Approach Phases of Project

20
Implementation Approach System Overview ETL Access Data from Source Systems Data Warehouse and Data Marts Reports and Dashboard created and presented

21
Implementation Approach Key Success Factors Data Governance Metadata to support data and associated processes Data Security Data of sufficient quality Data maintenance Project Governance Ensuring the project has sufficient cost benefit ratio Organizational Readiness Technical Complexity Do we have the IT staff to support this in the future? How many consultants are we going to need? Stakeholder Communication Steps put in place to ensure that all stakeholders are up to speed on project. This includes updates of performance during the testing periods.

Similar presentations


 support PMO 15 October 2014, London, Olympia.>")


 –Range of applications, practices, and technologies for the extraction, translation, integration,>")


