Download presentation
Presentation is loading. Please wait.

1
Geographical Investigations for the Alternative to Coursework (Paper 04) Data Collection
 Data Collection")
2
Data When conducting geographical (and most other science) investigations and research, information will need to be collected. This information is called data. Data may be collected as a group or on an individual basis.

3
Types of Data There are two types of data based on how the information was obtained: – Primary Data is new data that has never been collected before. If you are the researcher and no one has collected a particular piece of data at the same time and place as you, it is primary data. – Secondary Data is information collected from another source. Information in a textbook or on the internet would be considered secondary data. The source is called a secondary source.

4
Data Collection Methods Primary, properly collected data can be very valuable since valid conclusions can be drawn from it. However, improperly collected data can be misleading, giving invalid conclusions and wrong information.

5
Data Collection Methods To collect data in a sound and logical way so that valid conclusions can be drawn, one should be aware of the following processes: – sampling – pilot studies / surveys – questionnaires and interviews – methods of observing, counting and measuring – health and safety and other restrictions

6
SAMPLING DATA COLLECTION METHODS

7
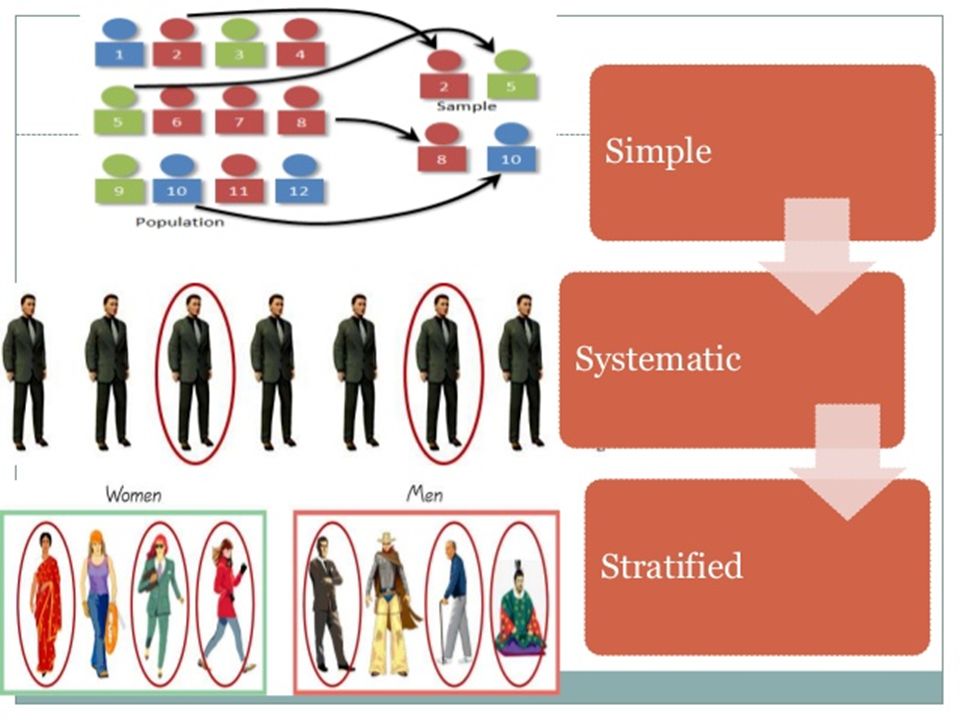
Key Terms A sample is “a smaller (but hopefully representative) collection of units from a population used to determine truths about that population”. –Sampling is the act of taking a sample. A population is a group which includes all people or items with the characteristic one wishes to understand.

8
Key Terms Bias – this occurs when data is intentionally selected or is more likely to be selected because of the sampling method used. –For example, in a study investigating the perceptions of crime on a local community, the researcher may find it desirable to interview only females when sampling. This study will have bias built into the questionnaire as males would be disregarded. –Unless one is intentionally seeking to identify a biased set of data, one should use a method that avoids bias. –Biased data is often unreliable and should not be used to make conclusions (unless the bias is identified).
..")
9
Reasons for Sampling When carrying out data collection (fieldwork), we may want to study groups with similar characteristics. – For example couples with children living in a particular town. However, such groups, called populations, can be very large and for many geographical investigations it is impossible to obtain ‘complete’ information about the entire group.

10
Reasons for Sampling This is usually because it would just take too long in terms of both time and cost to do so. – For example, if you wanted to study the shopping habits of all the households in a suburban area by using a doorstep questionnaire, it would be a huge task to visit every household. Instead of trying to find out about the entire population, it is valid to take a ‘sample’ or proportion of this total ‘population’ of households.

11
Reasons for Sampling We can save both time and money by using a sample to look at a small percentage of the total population. When might you sample the entire population? – When your population is very small – When you have extensive resources – When you don’t expect a very high response

12
A Visual Representation of the Sampling Process

13
Reasons for Sampling Sampling (collecting a sample) is seen as a fair and unbiased way of determining the characteristics of the whole group by studying a small subset of the whole. Providing that certain rules are followed, sampling allows one to select a group that will be representative of the total population and is a necessary part of many geographical investigations. A totally representative sample will tell you everything you might need to know about the population.

14
Reasons for Sampling Care, however, must be taken to avoid bias. – For example, if administering questionnaires or interviews, the investigator must not select which people should be asked to answer questions. He or she may choose those who look most friendly, or are of a similar age to them.

15
Representative Samples Three important factors influence how representative of the total population a sample can be: – Sampling methods – Sample size – Participation (response)
")
16
Sampling Methods A researcher might decide to take a 5% or 10% sample from a population of 1000. This gives a sample size of 50 or 100. However, how does he/she decide which 50 or 100 units of the population to sample? We will look at 3 recognised sampling methods (there are many more) that are considered scientifically valid since they avoid any bias which would render the results unreliable.
 that are considered scientifically valid since they avoid any bias which would render the results unreliable..")
17
Sampling Methods - 1 Random Sampling – This method involves selecting sample points by using random numbers. – Tables of random numbers can be used or the numbers can be generated by most calculators. – The use of random numbers guarantees that there is no human bias in the selection process and each item in the population has an equal chance of being selected.

18
Table of Random Numbers The table can be read in any direction. Using the horizontal arrow, one gets 20, 17, 42, 01, 72 etc. Using the vertical arrow, one may get 01, 27, 49, 49, 20 etc. This list can then be used to identify which members of a population one can sample. – For example, if one is interviewing visitors to a National Park, the 20 th, then 17 th, 42 nd, 1 st etc. person can be questioned.

19
Pros and Cons Advantages Can be used with large sample populations. Avoids bias Disadvantages Can lead to a poor representation of the population if large areas are not represented by the random numbers generated There may be practical considerations in terms of time available and access to certain parts of the study area.

20
Sampling Methods - 2 Systematic Sampling – With this method the sample is taken in a regular way. It might, for example, involve every tenth house or person. When using an Ordnance Survey map it might mean analysing grid squares at regular intervals. – The approach is different from random sampling in that there is some structure or underlying order to the way the data is selected for sampling.

21
Sampling Methods - 2 Systematic Sampling – For instance, when interviewing members of the public, you could decide to talk to every 5 th person you meet. – This is also an easy technique to use in physical geography e.g. if measuring weather, you could take measurements of wind speed and wind direction every 3 days.

22
Systematic Sampling

23
Pros and Cons Advantages A good coverage of the study area can be achieved more easily than in random sampling. It may be faster and more straight-forward than random sampling. Grids or lines don’t have to be used, just regular intervals. Disadvantages It is more biased – not all members of the population have an equal chance of being chosen. It can lead to over – or under-representation of certain patterns. If points and lines are used they may miss variations.

24
Sampling Methods - 3 Stratified Sampling – This approach is chosen when the researcher wants to deliberately bias the data. – This is done when the relative proportions of different groups / subsets within the population have to be taken into account in the sample. – The sample is stratified in this way to ensure that the results are proportional and representative of the population.

25
Sampling Methods - 3 Stratified Sampling – For example, if one was trying to work out the characteristics of different groups of workers in a town, then questionnaires would be concentrated on those groups. Thus, you may choose to look at 20 members of 3 different groups – the unemployed, factory workers and professionals. – Similarly, if you knew that the proportion of pensioners in an area was 30% and you wanted to represent this in your sample, you would ensure that 30% of the sample contained the views of pensioners.

26
Sampling Methods - 3 Stratified Sampling – In a further example, suppose an area under study divides into different natural areas. For example, rock type A may make up 60 per cent of an area and rock type B the remaining 40 per cent. If you were taking soil samples for each type, you should ensure that 60 per cent of the samples were taken on rock type A and 40 per cent on rock type B.

27
Stratified Sampling Within the stratified sample, you can the use random or systematic sampling methods to then work out the particular persons you are going to study.

28
Pros and Cons Advantages It can be used with other sampling methods as well as point, line and area techniques. If proportions of the subsets are known it can generate results which are more representative of the population. Advantages It is very flexible and applicable to many geographical enquiries. Correlations and comparisons can be made between the groups / subsets. Reduces bias in an area of contrasts.

29
Pros and Cons Disadvantages The proportions of the subsets must be known and accurate if it is to work properly. Disadvantages It can be hard to stratify the questionnaire data collection – accurate, current population data may not be available and it may be hard to correctly identify a person’s age or social background.

31
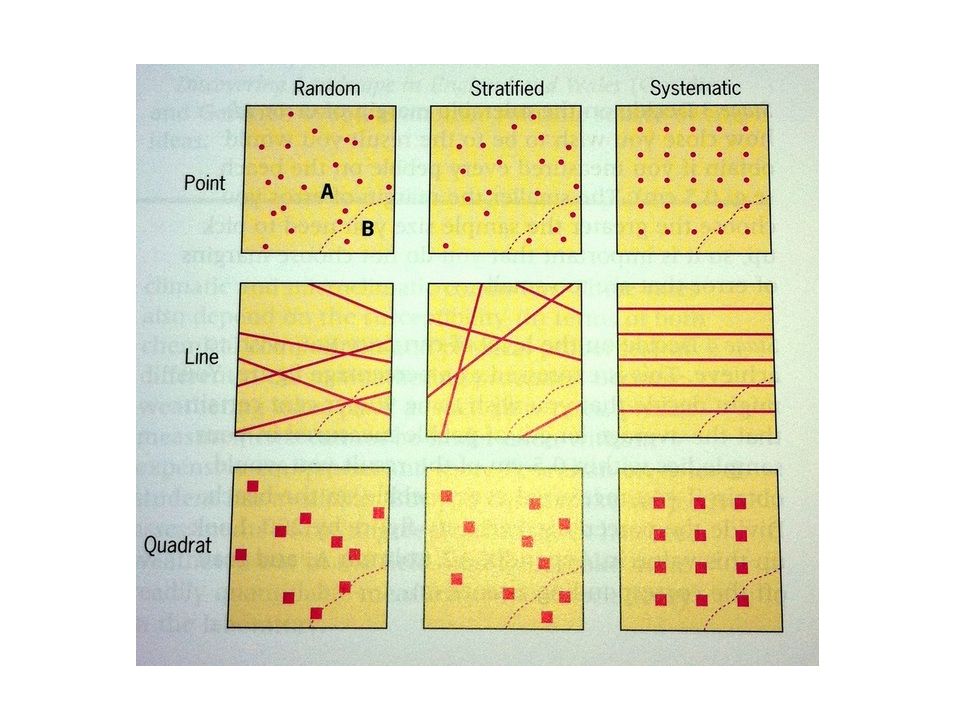
Sampling Types Depending on the type of data being collected, a certain type of sampling may be preferred. These are three ways to use the 3 sampling methods. – Point Sampling – making an observation or measurement at an exact location, such as an individual house or a precise 6-figure grid reference. These locations may be chosen using any of the previous sampling methods.

32
Sampling Types – Line Sampling – taking measurements along a carefully chosen line or lines, such as a transect across a sand dune ecosystem. Where the measurement is taken along the line can be decided using a sampling method. – Quadrat (area) Sampling – a quadrat is a gridded, square frame which is mainly used for surveying vegetation and beach deposits. Their placement is determined using a sampling method.
 Sampling – a quadrat is a gridded, square frame which is mainly used for surveying vegetation and beach deposits. Their placement is determined using a sampling method..")
34
Representative Samples Three important factors influence how representative of the total population a sample can be: – Sampling methods – Sample size – Participation (response)
")
35
Sample Size Before deciding on the various methods and techniques described above you should decide on the actual amount of the population you should sample such that your results are truly representative of the entire population. Generally, the larger the sample size the more likely you are to obtain a true reflection of the total population.

36
Sample Size This may also be the case with a very small sample. However it is also likely that a small sample could give a very misleading picture of the total population.

37
Sample Size You should try to take as many samples as possible whilst having regard to: – the time available – the availability of resources – the number of samples required if particular statistical techniques are going to be used e.g. Spearman’s Rank Correlation Coefficient or Chi- squared Test. – your capacity to handle the volume and complexity of the data collected.

38
Points to remember Sometimes you may asked why samples are retaken or tests repeated. The main reason for this is to improve the ‘reliability’ of the results or to make it a ‘fair test’. In such cases the readings may be averaged to reduce possible errors in reading instruments.

39
Points to remember Do not use ‘accurate’ when commenting on the results of sampling since total accuracy can only be achieved if the entire population is investigated and the work of all the researchers is accurate. A good sample will be as representative of the population as possible and will avoid bias.

40
Points to remember If samples are to be compared, they must all be taken at the same time, so that time is not a variable that can affect results. When quoting data, it is important to state the units, such as metres, minutes etc. as well as the values.

Similar presentations