Download presentation
Presentation is loading. Please wait.

1
Progress in the production and sharing of environmental indicators and their underpinning data in the countries of South-Eastern and Eastern Europe, Caucasus and Central Asia 16 th session of the Working Group on Environmental Monitoring and Assessment Istanbul, Turkey, 16-17 April 2015 Lukasz Wyrowski, Manager, UNECE Programme on Environmental Monitoring and Assessment

2
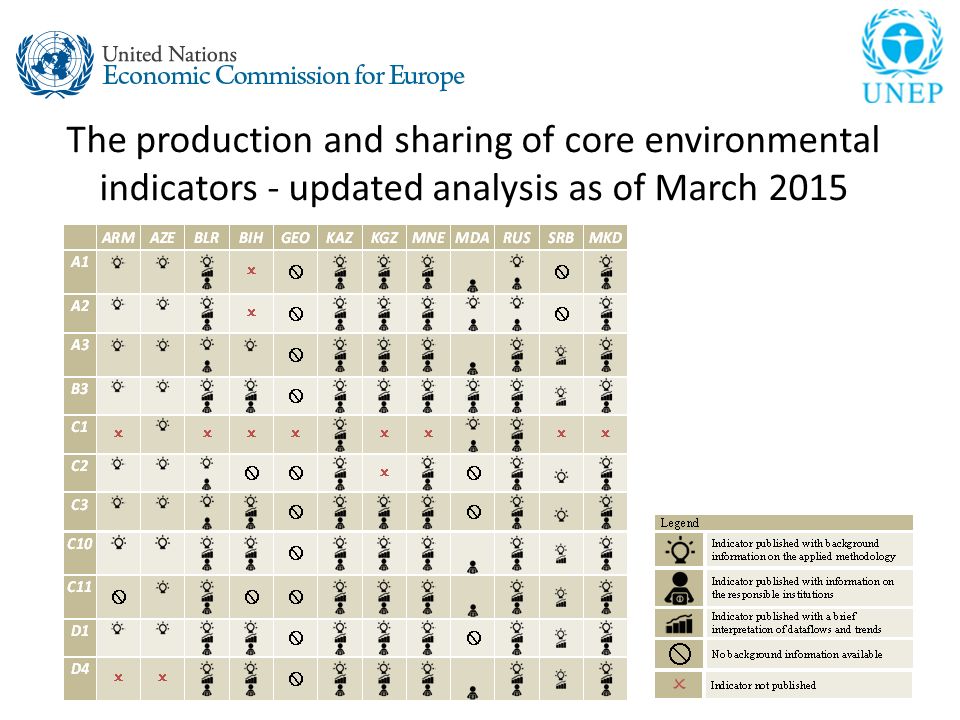
The production and sharing of core environmental indicators - updated analysis as of March 2015 12 countries of South-Eastern and Eastern Europe, Caucasus and Central Asia actively produce and share data and information on the UNECE core indicators Starting from 8 core indicators and 14 data flows in 2013, the current analysis reviews 14 core indicators and 44 data flows All 44 are among the 118 data flows from which the countries are invited to select the data flows constituting the pan- European SEIS

3
Indicator Dataflow ARM AZE BLR BIH GEO KAZ KGZ MNE MDA RUS SRB MKD Emissions of pollutants into the atmospheric air (A1) SO 2 NO X NMVOCs NH 3 CO CH POPs Heavy Metals PM Ambient air quality (A2) NO 2 SO 2 O3O3 PM 10 Consumption of ozone-depleting substances (A3) Total consumption of ODS ODS broken down by different substances Greenhouse gas emissions (B3) Total GHG emissions LULUCF GHGs broken down by different gases Renewable freshwater resources (C1) Total renewable freshwater resources Freshwater abstraction (C2) Fresh surface water abstracted Fresh groundwater abstracted Total freshwater abstraction Water Exploitation Index The production and sharing of core environmental indicators - updated analysis as of March 2015
 SO 2 NO X NMVOCs NH 3 CO CH POPs Heavy Metals PM Ambient air quality (A2) NO 2 SO 2 O3O3 PM 10 Consumption of ozone-depleting substances (A3) Total consumption of ODS ODS broken down by different substances Greenhouse gas emissions (B3) Total GHG emissions LULUCF GHGs broken down by different gases Renewable freshwater resources (C1) Total renewable freshwater resources Freshwater abstraction (C2) Fresh surface water abstracted Fresh groundwater abstracted Total freshwater abstraction Water Exploitation Index The production and sharing of core environmental indicators - updated analysis as of March 2015")
4
Indicator Dataflow ARM AZE BLR BIH GEO KAZ KGZ MNE MDA RUS SRB MKD Total water use (C3) Total freshwater available Losses of water during transport Total freshwater use (by economic activities) BOD5 and concentration of ammonium in rivers (C10) BOD 5 in rivers Ammonium in rivers Nutrients in freshwater (C11) Nitrates in lakes Total phosphorus in lakes Phosphates in rivers Nitrates in rivers Nitrates in groundwater Protected areas (D1) Total protected areas by IUCN categories Threatened and protected species (D4) Number of species protected Number of species threatened Fertilizer Consumption (F2) Agricultural area Total consumption of mineral fertilizers Area treated with mineral fertilizers Total consumption of organic fertilizers Area treated with organic fertilizers Passenger transport demand (H1) Total passenger transport demand Passenger transport demand by different modes of transport Waste generation (I1) Annual municipal waste generation The production and sharing of core environmental indicators - updated analysis as of March 2015
 Total freshwater available Losses of water during transport Total freshwater use (by economic activities) BOD5 and concentration of ammonium in rivers (C10) BOD 5 in rivers Ammonium in rivers Nutrients in freshwater (C11) Nitrates in lakes Total phosphorus in lakes Phosphates in rivers Nitrates in rivers Nitrates in groundwater Protected areas (D1) Total protected areas by IUCN categories Threatened and protected species (D4) Number of species protected Number of species threatened Fertilizer Consumption (F2) Agricultural area Total consumption of mineral fertilizers Area treated with mineral fertilizers Total consumption of organic fertilizers Area treated with organic fertilizers Passenger transport demand (H1) Total passenger transport demand Passenger transport demand by different modes of transport Waste generation (I1) Annual municipal waste generation The production and sharing of core environmental indicators - updated analysis as of March 2015")
6
The production and sharing of core environmental indicators – progress since May 2014 Performance in producing and sharing 14 dataflows between May 2014 and March 2015 ArmeniaAzerbaijan

7
The production and sharing of core environmental indicators – progress since May 2014 BelarusRepublic of Moldova Georgia

8
The production and sharing of core environmental indicators - updated analysis as of March 2015 The full analysis will soon be available under: http://www.unece.org/index.php?id=35516#/ http://www.unece.org/index.php?id=35516#/

Similar presentations
 Programme: Specific project for the participation of West Balkan Countries in the work of EEA 2009-2011.>")


, Augustin Colette, Bart Degraeuwe, Pieter Hammingh,>")


 16 th session of the Working Group on Environmental Monitoring and Assessment Istanbul, Turkey,>")


