Download presentation
Presentation is loading. Please wait.

1
Modelling activities at Institute of Oceanography and Fisheries (IOF), Split within ADRICOSM-EXT project Gordana Beg Paklar Institute of Oceanography and Fisheries, Split, Croatia
, Split within ADRICOSM-EXT project Gordana Beg Paklar Institute of Oceanography and Fisheries, Split, Croatia")
2
Subtask 1.6.2. – Improvement of coastal forecasting activities in marine area influenced by discharge of Neretva River Contributions from: IOF, Split; Faculty of Civil Engeneering (FCE), Split; Faculty of Civil Engeneering (FCE), Mostar Task 1.8. – Continuation of ADRICOSM forecasting activities Contributions from: IOF, Split; University of Zagreb, Geophysical Institute (UZGI), Zagreb Introducing realistic river discharges and precipitation data Increasing of the horizontal resolution in the area influenced by Neretva River; river parametrisation according to Kourafalou et al. (1997) Comparison of the model results with available measurements (RMS errors)
, Split; Faculty of Civil Engeneering (FCE), Mostar Task 1.8. – Continuation of ADRICOSM forecasting activities Contributions from: IOF, Split; University of Zagreb, Geophysical Institute (UZGI), Zagreb Introducing realistic river discharges and precipitation data Increasing of the horizontal resolution in the area influenced by Neretva River; river parametrisation according to Kourafalou et al. (1997) Comparison of the model results with available measurements (RMS errors).")
3
BATHYMETRY OF ASHELF-2 MODEL dx=dy=1km 189x106 points; 50% wet 16 sigma levels DTE=7 s, DTI=140 s Position of ASHELF-2

4
Climatological - perpetual year Interannual - 01/01/2000 – 31/03/2003 Forecast - 7 days (starting Tuesday) 1 April – 30 September 2003 INITIAL CONDITIONS FROM AREG SIMULATION RUN OPEN BOUNDARY ONE WAY NESTING WITH DAILY AVERAGED VALUES OF U, V, T, S AND FROM AREG FORCINGS: Surface momentum and heat fluxes are interactively computed using ECMWF 6 hour analysis and instanteneous sea surface temperature from ASHELF-2. WIND STRESS – Hellermann and Rosenstein (1983) HEAT FLUXES Q net =Q sol -Q up Q sol – shortwave radiation Q up – sensible + longwave + evaporative Shortwave – Reed (1977) Longwave – May (1986) Evaporative – Kondo (1975) Sensible – Kondo (1975) WATER FLUXES Q W =Q E /L-P-R (relaxation to ATOS) Q E – evaporative flux L – latent heat P – precipitation (climatological monthly mens – Legates, Willmott 1990) R – rivers (Jadro, Žrnovnica, Cetina, Neretva – climatological monthly mean discharges) SIMULATIONS within ADRICOSM project
 HEAT FLUXES Q net =Q sol -Q up Q sol – shortwave radiation Q up – sensible + longwave + evaporative Shortwave – Reed (1977) Longwave – May (1986) Evaporative – Kondo (1975) Sensible – Kondo (1975) WATER FLUXES Q W =Q E /L-P-R (relaxation to ATOS) Q E – evaporative flux L – latent heat P – precipitation (climatological monthly mens – Legates, Willmott 1990) R – rivers (Jadro, Žrnovnica, Cetina, Neretva – climatological monthly mean discharges) SIMULATIONS within ADRICOSM project.")
6
CTD stations in ASHELF-2 domain.

7
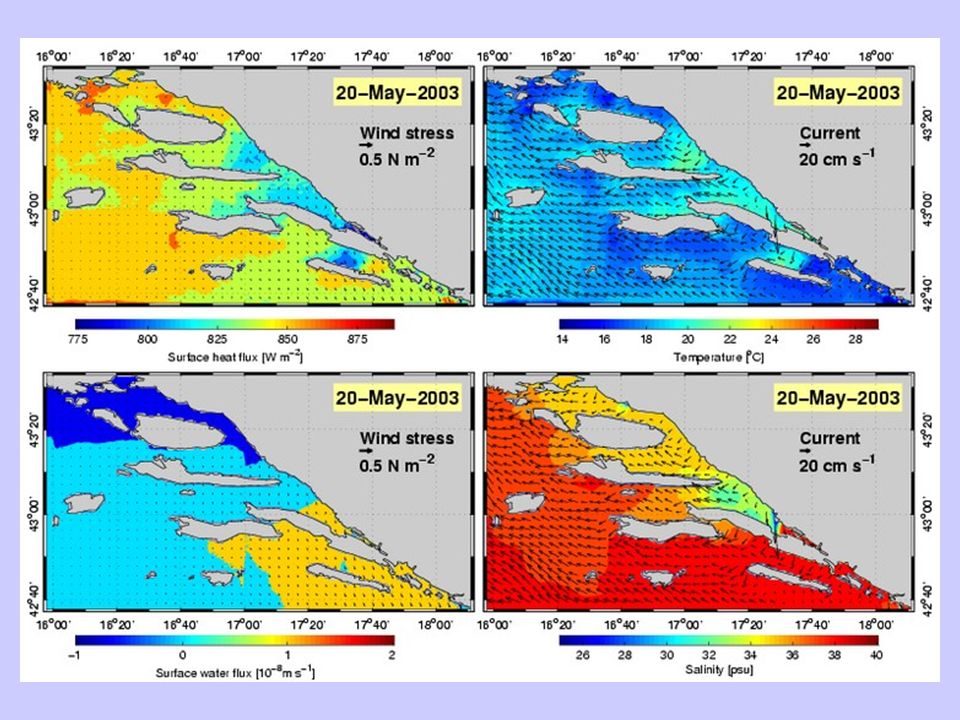
Comparison between model simulation for period 20 – 26 May 2003 and CTD measurements on 20 May 2003

8
Problems with salinity fields Climatological precipitation and river discharge data

10
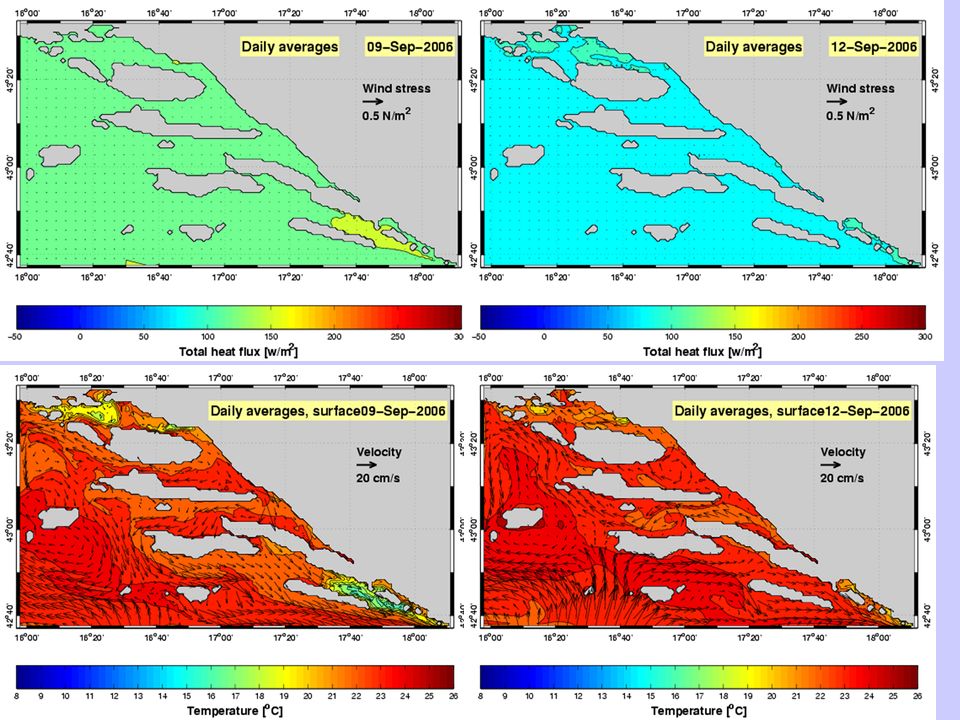
20 May 2003 14 August 2003 overmixing

11
T – profile 1 T – profile 2 T – profile 3 T – allS – profile 1 S – profile 2 S – profile 3 S – all 0.87 1.88 0.711.23 1.09 1.601.581.39 T – profile 1 T – profile 2 T – profile 3 T – allS – profile 1 S – profile 2 S – profile 3 S – all 1.491.941.861.740.830.840.680.79 RMS errors 20 May 2003 RMS errors 14 August 2003

12
Experiments with realistic precipitation and river discharges data

15
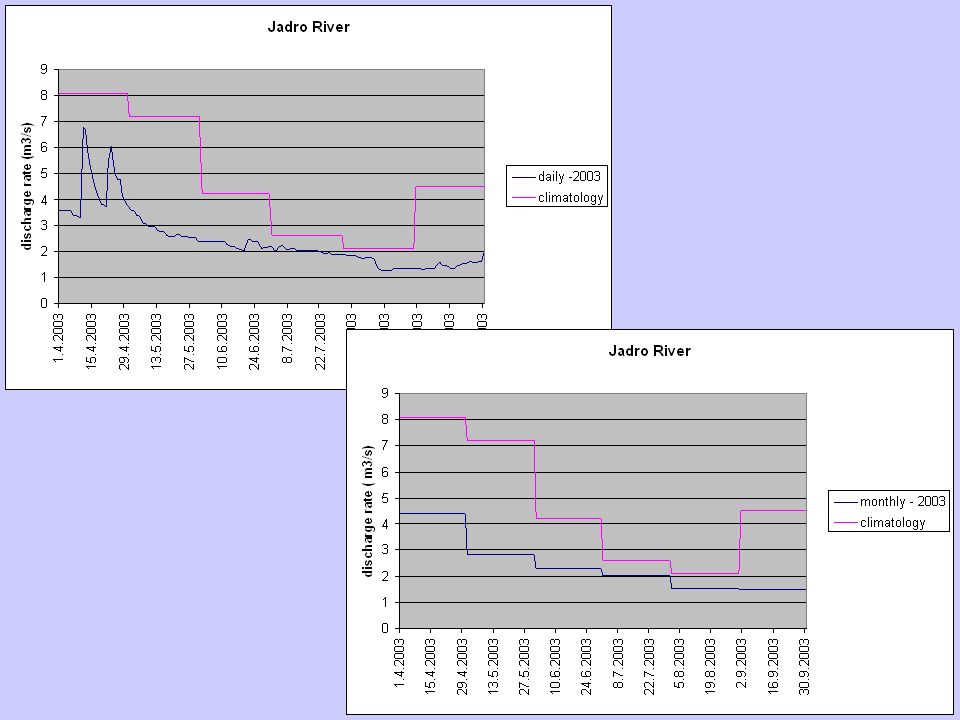
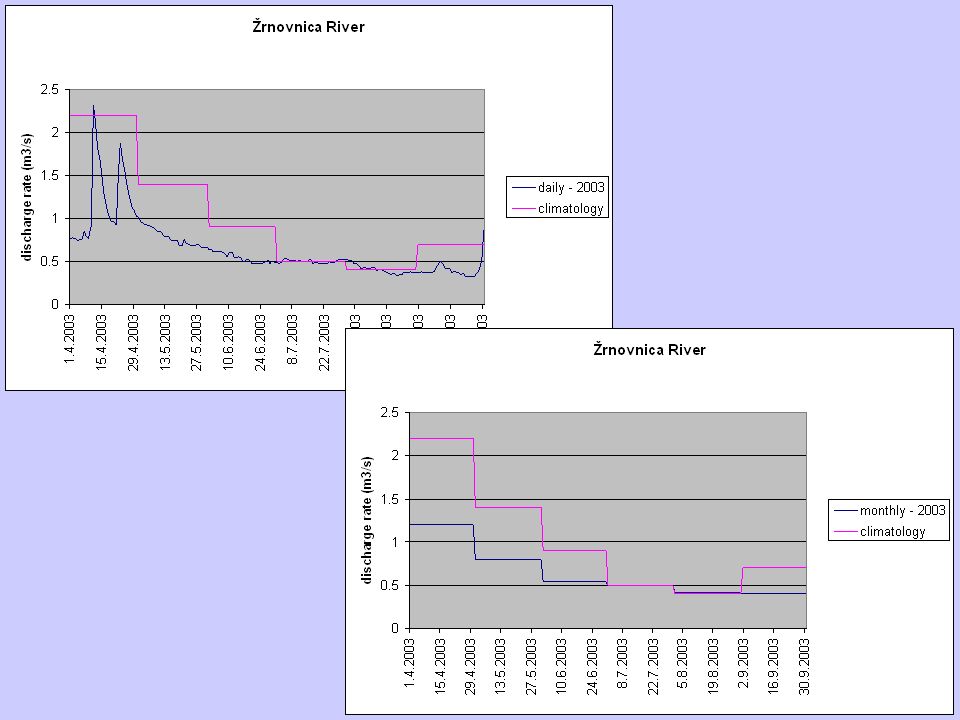
daily –2003 monthly –2003 climatology

16
E0 – climatological values for precipitation and river dischargs E1 – daily precipitation and river dischargs (2003) E2 – monthly precipitation and river dischargs (2003) E3 – daily precipitation and river dischargs without water flux correction Eksp rms TS E01.2251.390 E11.2251.390 E31.2251.476 20 May 2003 Eks rms TS E01.7370.788 E11.7370.788 E31.7281.147 14 August 2003
 E2 – monthly precipitation and river dischargs (2003) E3 – daily precipitation and river dischargs without water flux correction Eksp rms TS E E E May 2003 Eks rms TS E E E August 2003")
17
Implementation of high resolution model ACOAST2.1 Strong space- and time- variability of the Neretva River plume was not entirely captured by ASHELF2 model

18
Implementation of high resolution coastal model (ACOAST2.1) with 250 m horizontal resolution Depth (m) ACOAST2.1 Position of ASHELF2 domain. Position of ACOAST2.1 domain.

19
Numerical domains of ASHELF2 and ACOAST2.1 models. dx=dy=250 m IM=124 JM=288 DTE=2.8 s

20
Process-oriented studies horizontal resolution (1000 and 250 m) river parametrisation discharge rate wind stress
 river parametrisation discharge rate wind stress")
21
Surface current fields obtained within 1 km (upper) and 250 m (lower) grid under calm (left) and moderate bora (right) conditions. Neretva discharge was 300 m 3 /s in all experiments.

22
Surface current fields obtained with river parameterisation according to Zavatarelli and Pinardi (2003) (upper) and Kourafalou et al. (1996) (lower) under calm (left) and moderate bora (right) conditions. Neretva discharge was 300 m 3 /s in all experiments.
 (lower) under calm (left) and moderate bora (right) conditions. Neretva discharge was 300 m 3 /s in all experiments..")
23
Surface salinity fields obtained with river parameterisation according to Zavatarelli and Pinardi (2003) (upper) and Kourafalou et al. (1996) (lower) under calm (left) and moderate bora (right) conditions. Neretva discharge was 300 m 3 /s in all experiments.
 (lower) under calm (left) and moderate bora (right) conditions. Neretva discharge was 300 m 3 /s in all experiments..")
24
Surface salinity fields obtained with Neretva River discharge of 50 m 3 /s (left) and 300 m 3 /s (right) under calm (up) and moderate sirocco (down) conditions. River parameterisation was according to Kourafalou et al. (1996).
..")
25
Depth (m) ACOAST2.1 Task 1.8 Continuation of ADRICOSM forecasting activities
 ACOAST2.1 Task 1.8 Continuation of ADRICOSM forecasting activities")
27
12 July 2006 – transect 1 T – profile 1T – profile 2T – profile 3T – allS – profile 1S – profile 2S – profile 3S – all 2.1452.2412.0912.15680.4090.3741.0900.680 RMS errors

28
12 July 2006 – transect 4 RMS(T)=2.101 0 CRMS(S)=2.390
= CRMS(S)=2.390")
29
12 July 2006 – transect 5 RMS(T)=2.127 0 CRMS(S)=2.793
= CRMS(S)=2.793")
31
T – profile 1T – profile 2T – profile 3T – allS – profile 1S – profile 2S – profile 3S – all 1.611.632.051.7590.3340.4070.4010.376 12 September 2006 – transect 1 RMS errors

32
12 September 2006 – transect 4 RMS(T)=1.524 0 CRMS(S)=2.779
= CRMS(S)=2.779")
33
12 September 2006 – transect 5 RMS(T)=1.213 0 CRMS(S)=2.427
= CRMS(S)=2.427")
34
Examples – strong winds

35
Example – salinity field

36
Example – bottom velocity

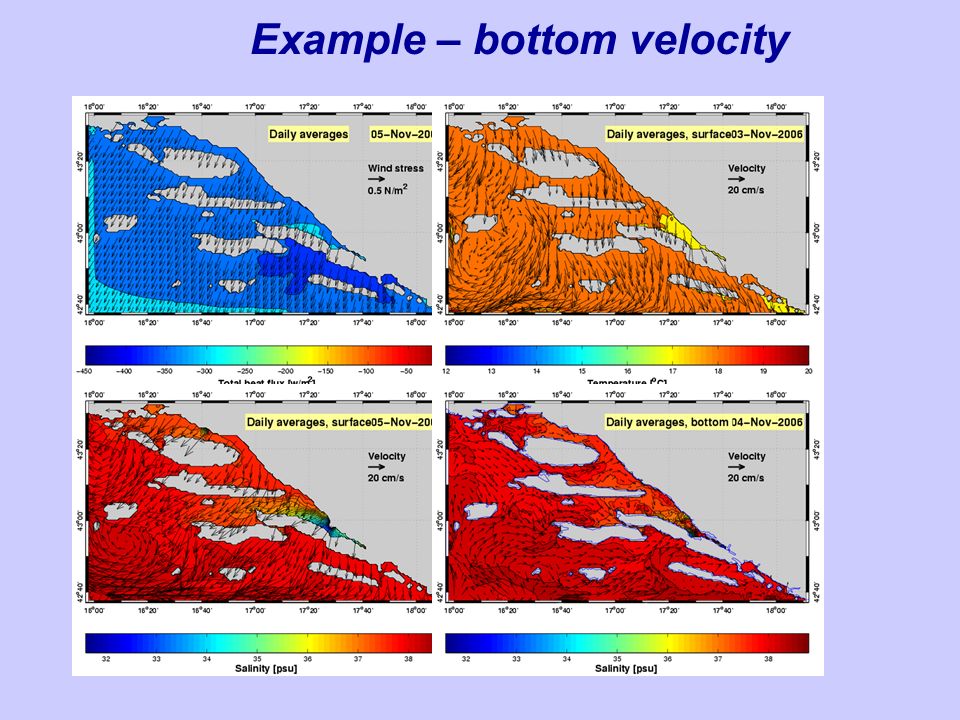
38
Conclusions RMS errors in temperature profiles arise from too strong model mixing. In 2003 inaccuracy in the salinity field resulted from forcing the model with climatological river and precipitation data. In 2006 inaccurate salinity values in the area influenced by Neretva River were obtained due to inaccurate river parameterisation. Surface currents and river plums are strongly influenced by the wind pattern. Model results bring new insight to some important physical mechanism in the area like current reversal, upwelling, wakes behind islands etc.

39
2002

Similar presentations


 INKWEON BANG CHRISTOPHER N.K. MOOERS OCEAN PREDICTION EXPERIMENTAL LABORATORY (OPEL)>")


Background and Motivation 2)Role of Physical Forcing 3)Simplified.>")
, M ira Morović 1* (optical), Frano Matić 1,>")

