Download presentation
Presentation is loading. Please wait.

1
Primary Production

2
Remote Sensing of Ocean Colour: Visible Spectral Radiometry

3
Flora of the Ocean Predominantly single-celled and microscopic (0.5 to 250μ) Green plants (chlorophyll pigments, photosynthesis) Mostly confined to the surface (illuminated) layer Ubiquitous and abundant (up to 10 5 cells ml -1 ) Control colour of water (detectable from space) Consume carbon dioxide (ocean carbon cycle, greenhouse effect) Collective metabolism enormous (50 x 10 9 tonnes per annum) Slightly negatively buoyant
 Green plants (chlorophyll pigments, photosynthesis) Mostly confined to the surface (illuminated) layer Ubiquitous and abundant (up to 10 5 cells ml -1 ) Control colour of water (detectable from space) Consume carbon dioxide (ocean carbon cycle, greenhouse effect) Collective metabolism enormous (50 x 10 9 tonnes per annum) Slightly negatively buoyant")
4
Ocean-Colour Remote Sensing Ocean-Colour Radiometry Ocean-colour remote sensing is a method of producing synoptic fields of phytoplankton biomass indexed as chlorophyll

5
Significance of Chlorophyll in Marine Ecosystems Chlorophyll concentration, an index of the biomass of phytoplankton, is the single most important property of the marine ecosystem whose value we would like to know on synoptic scales.

6
What is Plankton Biomass? Biomass of plankton is its local abundance. The equivalent term in fisheries is the stock size. For phytoplankton the index is concentration of chlorophyll.

7
What is Primary Production? Primary production is the rate of production of phytoplankton. The equivalent term in fisheries is reproduction and growth. If biomass like money in the bank, primary production is like the interest earned by the capital.

8
Determinants of Primary Production First-order: Light Pigment Biomass Second-order: Nutrients Temperature Community structure (cell size, taxa); Growth history (light; temperature) Stratification/ Vertical mixing
; Growth history (light; temperature) Stratification/ Vertical mixing")
9
What is the fate of primary production? Phytoplankton may be lost (erosion of capital) by a number of mechanisms They may sink to the bottom; They may be swept away by currents; They might die from disease; They may be eaten.
 by a number of mechanisms They may sink to the bottom; They may be swept away by currents; They might die from disease; They may be eaten..")
10
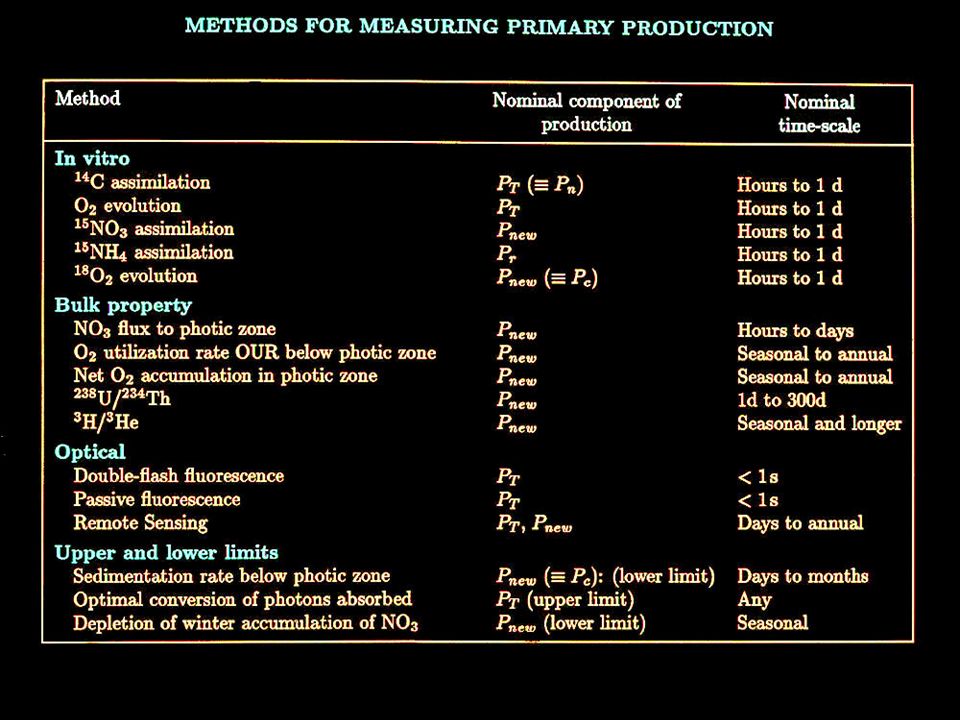
How do we measure primary production? The conventional method to measure primary production is a chemical technique. It can be done routinely at sea. However, it is time consuming.

11
H 2 O + CO 2 + CH 2 O + O 2 + Available Energy Absorbed Energy Dissipated Energy Stored Energy The Photosynthesis Equation Chlorophyll-a is at the heart of the photosynthetic reaction.

13
Growth Requirements of Phytoplankton The growth requirements of phytoplankton are similar to those of any green plant: Water Carbon dioxide Visible light Chemical nutrients (nitrogen, phosphorus, … often in short supply)
")
14
What makes primary production change? Primary production varies with region and season, because of changes in those factors essential for phytoplankton growth. These include the phytoplankton biomass; the intensity and duration of sunshine; the intensity of turbulence in the water; the concentration of certain chemicals (nutrients) in the water; the temperature; the kinds of phytoplankton present.
 in the water; the temperature; the kinds of phytoplankton present..")
15
What is the fate of primary production? Phytoplankton may be lost (erosion of capital) by a number of mechanisms They may sink to the bottom; They may be swept away by currents; They might die from disease; They may be eaten.
 by a number of mechanisms They may sink to the bottom; They may be swept away by currents; They might die from disease; They may be eaten..")
16
Surface biota ~ 3 GT C Globally, some 50 GT of carbon fixed by marine phytoplankton per annum About one third (~16 GT of carbon) is exported from surface layer by sinking Biological Pump Scales of comparison: Fossil fuel emissions are ~10 GT of carbon per annum Net primary production by terrestrial plants is considered to be roughly the same as marine primary production Oceanic CO2 Pools and Fluxes (Global)
 is exported from surface layer by sinking Biological Pump Scales of comparison: Fossil fuel emissions are ~10 GT of carbon per annum Net primary production by terrestrial plants is considered to be roughly the same as marine primary production Oceanic CO2 Pools and Fluxes (Global)")
18
Determinants of Primary Production First-order: Light Pigment Concentration Second-order: Nutrients Temperature Community structure (cell size, taxa); Growth history (light; temperature) Stratification/ Vertical mixing
; Growth history (light; temperature) Stratification/ Vertical mixing")
19
Hierarch of Primary Production Models Treatment Regression Deterministic Linear Non-linear Uniform Biomass Non-uniform Biomass Non-spectral Spectral Available Light Absorbed Light

24
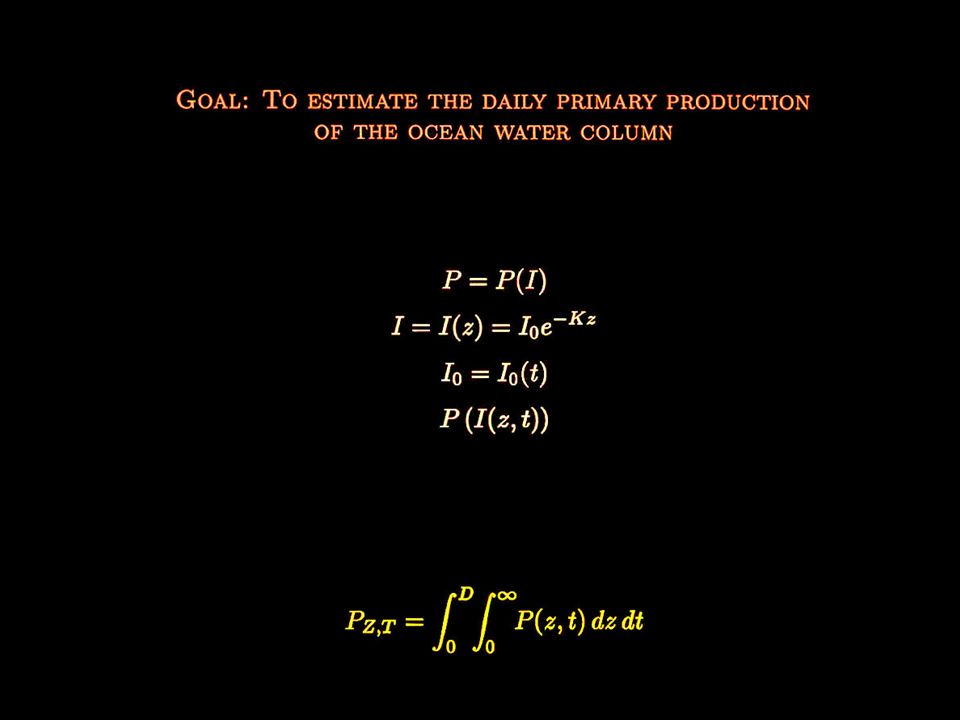
Computation of primary production Photosynthesis-light model Light penetration model Atmospheric transmission model Irradiance outside atmosphere Surface Irradiance Irradiance at depth Primary production at depth Biomass profile parameters Photosynthetic parameters Surface Biomass Sathyendranath and Platt (1989)
")
27
1.Compute light just below the sea surface 2.Estimate biomass at the surface 3.Define the biomass profile 4.Estimate parameters of the photosynthesis-light model 5.Compute parameters of light transmission underwater 6.Compute water-column primary production Basic Methodology for Computation of Primary Production

28
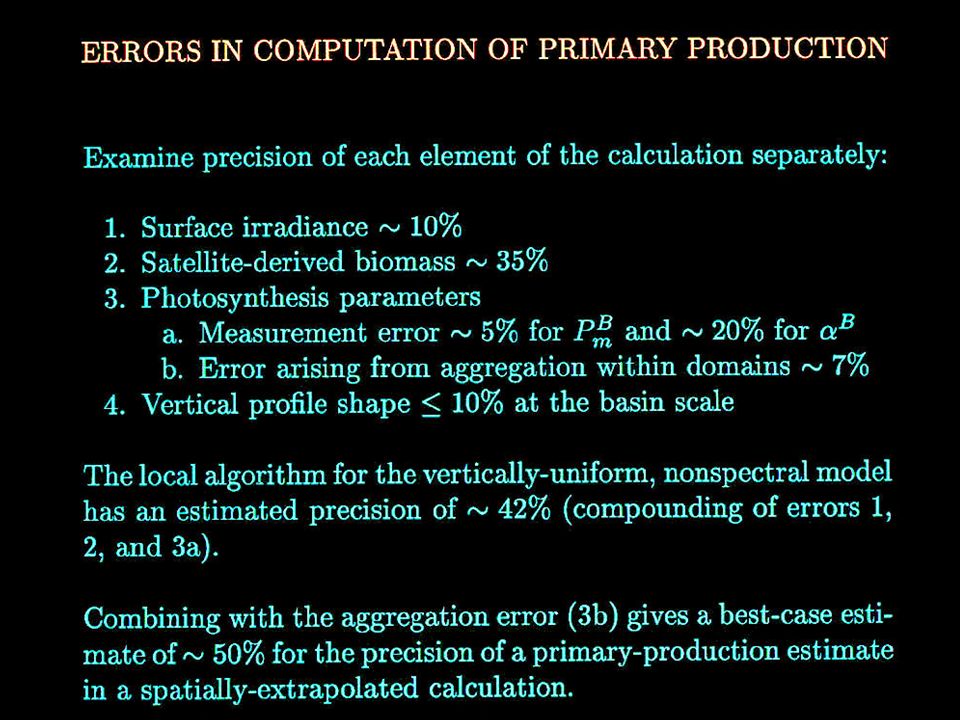
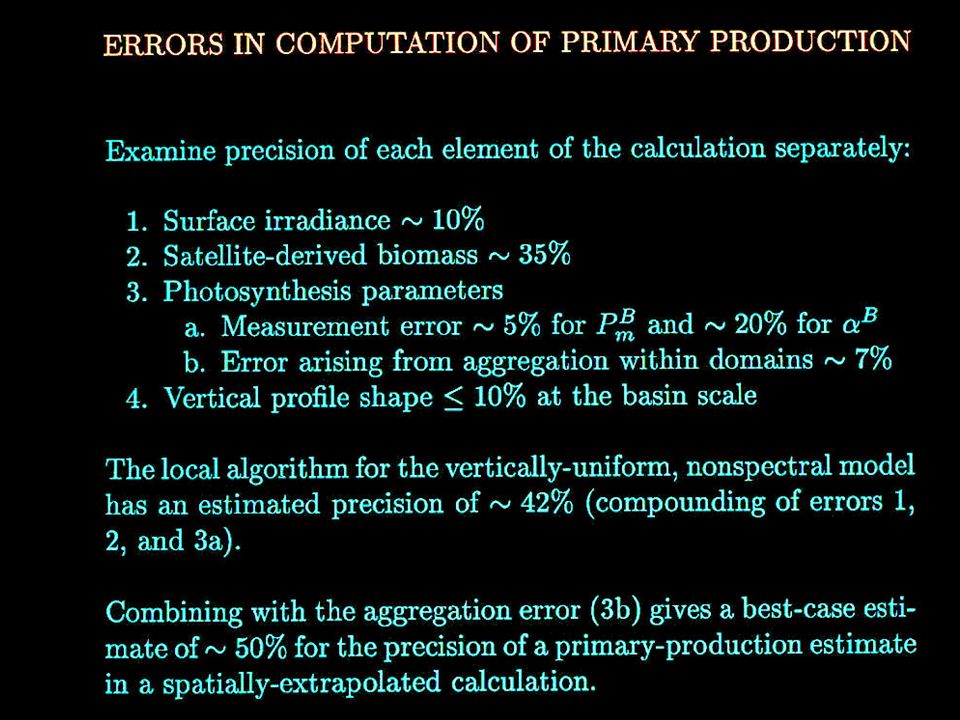
Primary Production at Regional Scale Computation of primary production at regional scale has two components: 1.Construct local algorithm, assuming all necessary information will be available. 2.Establish protocol for extrapolation of local algorithm to larger scale.

29
Ecological Provinces of the Ocean according to Longhurst

30
Assignment of Parameters for Computation of Primary Production The model is robust, but needs a protocol for assignment of parameters relating to (1) photosynthetic response; and (2) vertical structure. The protocol uses remotely-sensed data as input Platt et al. (2008)
.")
31
Saux-Picart et al. 2013, RSE

32
Computed Global Primary Production May 2004, using OC-CCI data

33
Utility of Remote Sensing For Estimation of Oceanic Primary Production P = P B x B Effect of environmental conditions (light, temperature, nutrients …) on primary production is contained explicitly (light) or implicitly (through model parameters) in the chlorophyll-normalised term. Chlorophyll concentration has a dynamic range of more then four decades. Remote sensing method is an extrapolation tool, which: Uses all available ship data to define model parameters Uses the satellite data to input the state variable (chlorophyll) and the forcing field (light) Sees the ship and satellite as complementary tools It is the method of choice Primary production P can be written as the product of production per unit chlorophyll concentration P B and the chlorophyll concentration B.
 and the forcing field (light) Sees the ship and satellite as complementary tools It is the method of choice Primary production P can be written as the product of production per unit chlorophyll concentration P B and the chlorophyll concentration B..")
34
Measurement of Instantaneous Rates Dimensions The dimensions of a rate quantity include time in the denominator Applicability The intrinsic time scale for the method, or the time scale on which the results can be expected to apply, is related to the duration of measurement

36
Problems with Validation 1.No independent method available for comparison. Remote- sensing approach uses all available data, from ship as well as from satellite. 2.Comparison with bulk-property, or indirect, methods compromised by incompatibility of time scales. Further, bulk- property methods and in vitro incubation methods (used to derive photosynthesis parameters) address different components of primary production. 3.Validation by prediction of biomass at some future time requires information on loss terms and on flow field: these are usually unavailable.
 address different components of primary production. 3.Validation by prediction of biomass at some future time requires information on loss terms and on flow field: these are usually unavailable..")
38
Monthly time Series of Primary production (using OC-CCI chlorophyll data and NASA data on surface light)
")
39
Time Series of Annual Primary Production Do we have “representational” error here when looking at “trends”? Satellite coverage improved in 2002. What about effect of inter-annual environmental variability on photosynthesis parameters? (Not accounted in this calculation)
.")
40
Three different methods for assigning Assimilation Number Province-based (no interannual variation) Nearest Neighbour Method (Platt et al. 2008) based on temperature and chlorophyll Dynamic assignment based on chlorophyll, temperature and light (Saux-Picart et al. 2013) This is a challenging area of research where progress has to be made
 based on temperature and chlorophyll Dynamic assignment based on chlorophyll, temperature and light (Saux-Picart et al. 2013) This is a challenging area of research where progress has to be made.")
41
In Conclusion 1.Remote sensing provides much of the information essential for computing primary production at large scales. 2.Potential exists for assigning parameters of the photosynthesis- irradiance curve using satellite data. This should be a priority for research. 3.Important to maintain a long time series of consistent ocean- colour data to study responses of marine primary production to climate variability and change.

44
Limitations of Ships for Data Collection Using ships, we can collect data of excellent quality. However, we are limited by slow speed of the vessel; poor peripheral vision; time required to make the observations; expense of repeat coverage. In other words, the coverage is poor, and the ocean badly under-sampled. There is a worldwide dearth of long time series data.

45
Advantages of Satellite Technology The effect of phytoplankton on the colour of the ocean can be detected by optical instruments carried on satellites in space, and can be used to measure the biomass. Satellite technology offers the following advantages: Synoptic coverage of large areas (peripheral vision); High resolution on the ground; Repeat coverage daily; Correction of the under-sampling problem; Can be used to estimate primary production.
; High resolution on the ground; Repeat coverage daily; Correction of the under-sampling problem; Can be used to estimate primary production..")
47
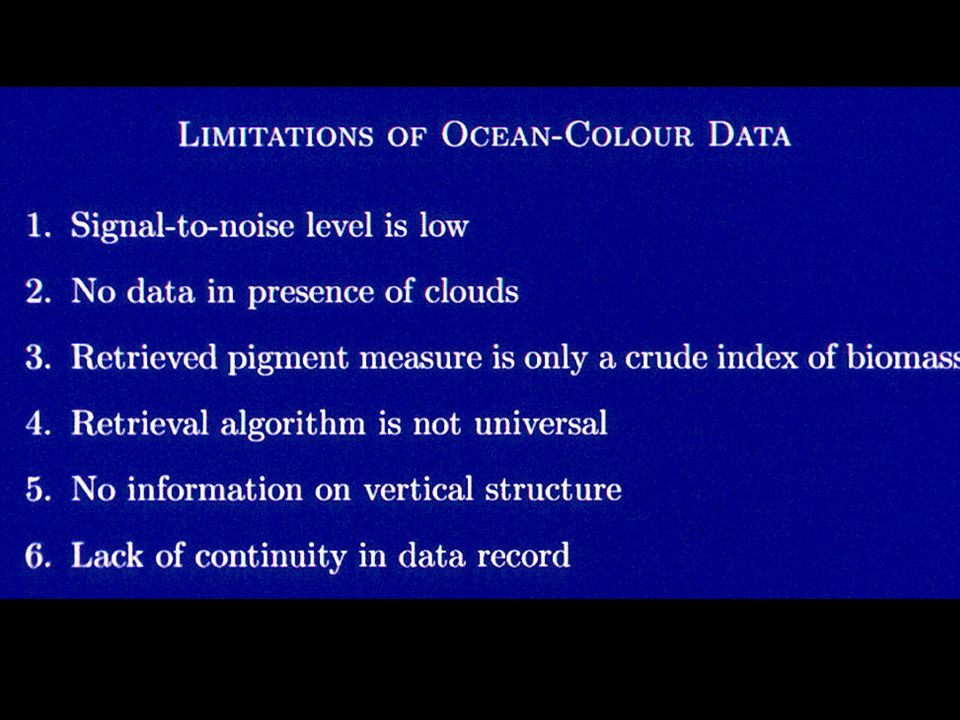
Vertical Structure in the Biomass Field The photic zone extends downwards from the surface for more than four optical depths More than 90% of the signal seen by the ocean-colour sensor comes from the first optical depth Considerable biomass of phytoplankton is often found below the first optical depth Does this invalidate the use of ocean-colour data for estimation of primary production?

48
Vertical Structure in Chlorophyll Concentration It is also necessary to account for the vertical structure in chlorophyll concentration. The simplest representation of chlorophyll peaks (for application in primary production studies) is as a Gaussian peak superimposed on a constant background.
 is as a Gaussian peak superimposed on a constant background..")
52
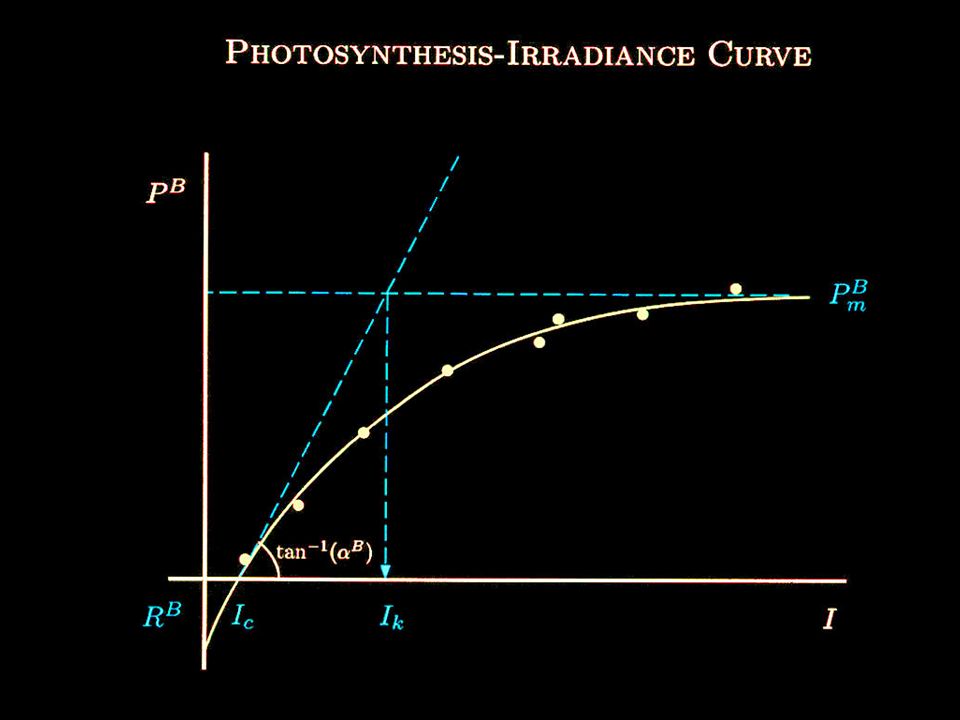
Basic Set of Parameters Needed in Primary Production Models Initial slope of photosynthesis-irradiance curve Assimilation number of photosynthesis- irradiance curve Specific absorption coefficient of phytoplankton Carbon-to-chlorophyll ratio of phytoplankton Of these, the carbon-to-chlorophyll ratio is the property we know the least about. Carbon-to-chlorophyll ratio is invoked when fields of phytoplankton carbon computed in biogeochemical models are converted to fields of chlorophyll-a, for comparison with satellite data. Sathyendranath et al. 2009 E c E k E

Similar presentations


 Achievements and challenges Nicolas Gruber Environmental Physics, ETH Zürich, Zurich, Switzerland. Using input from.>")


 Turquoise = phytoplankton bloom.>")


 and ecosystem interactions with climate Carbon management (e.g.,>")

 Need to relate “today’s”>")


 program Marine Microplankton Ecology>")
 Phytoplankton & Primary Production Dr Purdie SOC (566/18) LECTURE 6 Week 6 (i) Photosynthesis & Light (ii) Critical.>")
