Download presentation
Presentation is loading. Please wait.

1
POPULATION Human populations are an important part of geography.

2
Human Populations People are unevenly distributed on Earth.

3
Human Populations distribution Populations also vary greatly in terms of age and sex distribution… for example, how many males compared to females, or how many children compared to adults is different in different countries. Some countries have lots of children and few adults. Some countries have lots of adults and few children.

4
Human Populations Understanding the population and how its divided among age in one country can help us understand a country’s: well-being & challenges. Comparing the populations of different countries throughout the world can help us understand: – How countries around the world develop & grow – How and why countries participate in conflict – How countries cooperate with one another

5
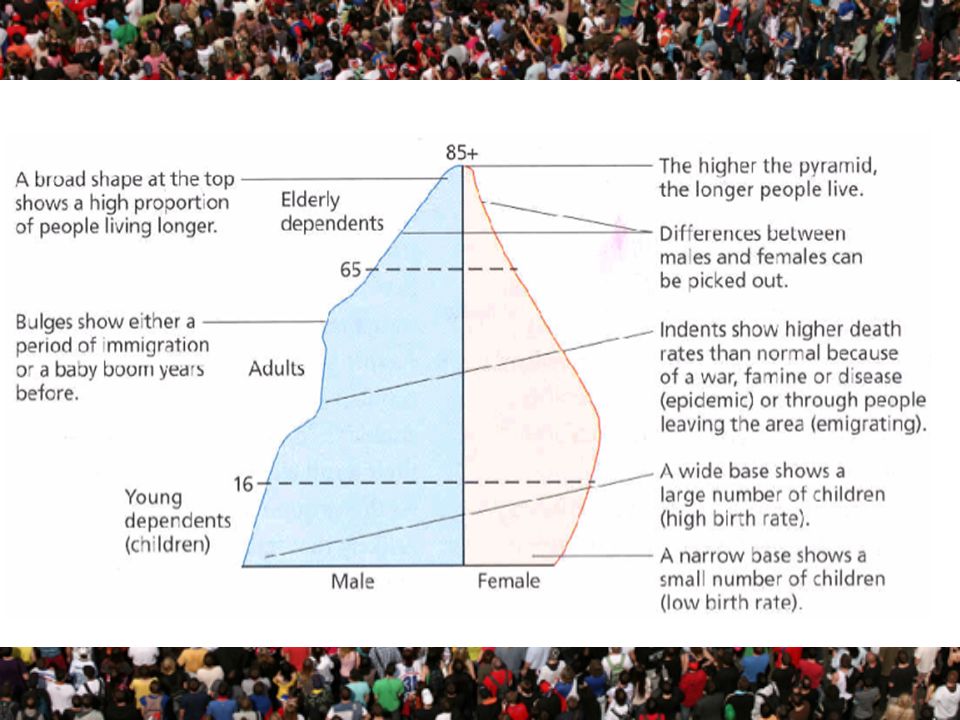
Population Pyramid A population pyramid is a special type of graph that shows the distribution of a location’s population in terms of age and sex.

6
Population structure WHERE does a population pyramid tell us about: Birth rate Death rate Life expectancy Economically Activity Dependents Social Factors such as: wars, famine, immigration, diseases, or baby booms.

8
Analysing Population Pyramids The shape of a population pyramid can tell us a lot about an area's population. What does it tell you if a pyramid is skinny at the top and fat at the bottom? What would it tell you if the pyramid was skinny at the bottom and fat at the top? How does it tell us information about birth rates, death rates, and life expectancy? UK, 2000 Mozambique, 2000

9
Analysing Population Pyramids Dependants: people who must depend on others for their finances/survival. There are two groups of dependants; young dependants (aged below 15) and elderly dependants (aged over 65). Dependants rely upon the economically active (people with jobs) for economic support ($$). Where are the economically active on any pyramid? Which pyramid has more economically active people? How can you tell? Would it be better or worse to have more economically active people in your country? Why? What kind of population distribution would be good for a country and what type(s) of distributions might be hard on a country? UK, 2000 Mozambique, 2000
 and elderly dependants (aged over 65). Dependants rely upon the economically active (people with jobs) for economic support ($$). Where are the economically active on any pyramid. Which pyramid has more economically active people. How can you tell. Would it be better or worse to have more economically active people in your country. Why. What kind of population distribution would be good for a country and what type(s) of distributions might be hard on a country. UK, 2000 Mozambique,")
10
Analysing Population Pyramids A population pyramid also tells us how many dependants there are. Many DEVELOPING COUNTRIES have a high number of young dependants, while many DEVELOPED COUNTRIES have a growing number of elderly dependants. Why might a country have a high number of young dependents? Why might a country have a high number of elderly dependents? UK, 2000 Mozambique, 2000

11
VACATION PROJECT Go to CIA World Factbook on Mrs. Bongle’s webpage. Find your country in the drop- down menu. Click on “People and Society”. Scroll down and look at AND think about the information in the following sections: – Population – Age Structure – Dependency Ratios – Median Age – Population Growth Rate – Birth Rate – Death Rate Population: 43,024,374 (July 2014 est.) country comparison to the world: 33 33 Age structure: 0-14 years: 24.9% (male 5,486,989/female 5,233,968) 15-24 years: 15.7% (male 3,445,086/female 3,301,168) 25-54 years: 38.9% (male 8,345,893/female 8,391,445) 55-64 years: 9.1% (male 1,895,965/female 2,017,330) 65 years and over: 11.4% (male 2,036,545/female 2,869,985) (2014 est.) population pyramid: Dependency ratios: total dependency ratio: 54.1 % youth dependency ratio: 37 % elderly dependency ratio: 17.1 % potential support ratio: 5.9 (2014 est.) Median age: total: 31.2 years male: 30.1 years female: 32.3 years (2014 est.) Population growth rate: 0.95% (2014 est.) country comparison to the world: 123 123 Birth rate: 16.88 births/1,000 population (2014 est.) country comparison to the world: 113 113 Death rate: 7.34 deaths/1,000 population (2014 est.) country comparison to the world: 119 119
 country comparison to the world: Age structure: 0-14 years: 24.9% (male 5,486,989/female 5,233,968) years: 15.7% (male 3,445,086/female 3,301,168) years: 38.9% (male 8,345,893/female 8,391,445) years: 9.1% (male 1,895,965/female 2,017,330) 65 years and over: 11.4% (male 2,036,545/female 2,869,985) (2014 est.) population pyramid: Dependency ratios: total dependency ratio: 54.1 % youth dependency ratio: 37 % elderly dependency ratio: 17.1 % potential support ratio: 5.9 (2014 est.) Median age: total: 31.2 years male: 30.1 years female: 32.3 years (2014 est.) Population growth rate: 0.95% (2014 est.) country comparison to the world: Birth rate: births/1,000 population (2014 est.) country comparison to the world: Death rate: 7.34 deaths/1,000 population (2014 est.) country comparison to the world:")
12
Vacation Project Click on the Population Pyramid in the “Age Structure” section. ADD THE POPULATON PYRAMID TO YOUR VACATION PROJECT PRESENTATION ( POPULATION SLIDE ). Be able to talk about why the shape of your pyramid is the way it is. Where are your largest and smallest populations based on age? What does this population pyramid tell you about the life in your country?
. Be able to talk about why the shape of your pyramid is the way it is. Where are your largest and smallest populations based on age. What does this population pyramid tell you about the life in your country .")
Similar presentations