Download presentation
Presentation is loading. Please wait.

1
Fundamentals of MD Simulations
Surface Adsorptions : “Equilibrium and Thermodynamics Studies for the adsorption of methane on SWCNTs Using Molecular Dynamics Simulations” Presented by: Mohamad Raad, Ph.D. Student Seminar 2 Supervised By: Prof. H. Behnejad Jan. 21, 2013 Faculty of Science , University of Tehran

2
Adsorption Is the accumulation of particles (adsorbate) at a surface (adsorbent or substrate). OR in other words , is the ability of substance to physically hold another substance in its surface. Adsorbate : the material being adsorbed. Adsorbent (also called substrate ): the solid material being used as the adsorbing phase. Adsorbate Adsorbent There are two principal modes of adsorption of molecules on surfaces : Physical adsorption ( Physisorption ) Chemical adsorption ( Chemisorption )
: the solid material being used as the adsorbing phase. Adsorbate. Adsorbent. There are two principal modes of adsorption of molecules on surfaces : Physical adsorption ( Physisorption ) Chemical adsorption ( Chemisorption )")
3
Physical adsorption: The adsorbate is held by weak, van der Waals type of forces on the surface. The attraction is not fixed to a specific site and the adsorbate is relatively free to move on the surface. This is relatively weak, reversible, adsorption capable of multilayer adsorption. Chemical adsorption: Some degree of chemical bonding between adsorbate and adsorbent characterized by strong attractiveness. Adsorbed molecules are not free to move on the surface. There is a high degree of specificity and typically a monolayer is formed. The process is seldom reversible. Bond formation between the adsorbate and the adsorbent is observed.

4
Physisorption Chemisorption Van der Waal -Hads < 35 kJ/mol
No energy barrier Never dissociative Many monolayers Not dependent on surface coverage Chemisorption Chemical bond -Hads > 35kJ/mol Varying energy barriers Often dissociative One monolayer Dependent on surface coverage 4

5
Factors Affecting Adsorption :
Surface area of adsorbent Particle size of adsorbent Contact time or residence time Solubility of solute (adsorbate) in liquid Affinity of the solute for the adsorbent Size of the molecule with respect to size of the pores Degree of ionization of the adsorbate molecule Temperature and Pressure Humidity PH
 in liquid. Affinity of the solute for the adsorbent. Size of the molecule with respect to size of the pores. Degree of ionization of the adsorbate molecule. Temperature and Pressure. Humidity. PH.")
6
The extent of adsorption of a species onto a surface is usually measured by Surface coverage which is given by : Adsorption capacity is defined as the maximum amount of a matter that can be attracted to and held on the surface of a given amount of a substance. This capacity is directly proportional to the surface area and is dependent on the solute partial pressure and the temperature. The pore size determines the type of substance that can be adsorbed. Three classes are given below: Micro porous adsorbents (<2nm diameter) Meso porous adsorbents (2nm to 50 nm diameter) Macro porous adsorbents (> 50 nm diameter)
 Meso porous adsorbents (2nm to 50 nm diameter) Macro porous adsorbents (> 50 nm diameter)")
7
Carbon Nanotubes as promising adsorbents : Carbon Nanotubes have many structures, differing in length, thickness, and in the type of helicity and number of layers. Because of its high affinity with both organic and inorganic chemicals , cylindrical shape , high specific area, uniform mesoporous diameter and high tensile strength ,CNTs have many potential applications, such as molecular sieves, sensors for some aromatics and also possess good potential for BTEX removal from aqueous solutions.

8
Carbon Nanotubes can be categorized by their structures : Single-walled carbon Nanotubes (SWCNTs) Multi-walled carbon Nanotubes (MWCNTs) Double-walled carbon Nanotubes (DWCNTs) SWCNTs are tubes of graphite that are normally capped at the ends. They have a single cylindrical wall. The structure of a SWNT can be visualized as a layer of graphite, a single atom thick, called graphene, which is rolled into a seamless cylinder. Most SWCNT typically have a diameter of close to 1 nm , a value which falls in the range normally defined by micropores . MWCNT, in contrast, show a small variation in core diameter, typically ranging from 3.5 to 7nm, and hence fall in the mesopore range . Adsorption on (SWCNTs) has been the focus of many experimental and theoretical studies.
 has been the focus of many experimental and theoretical studies.")
9
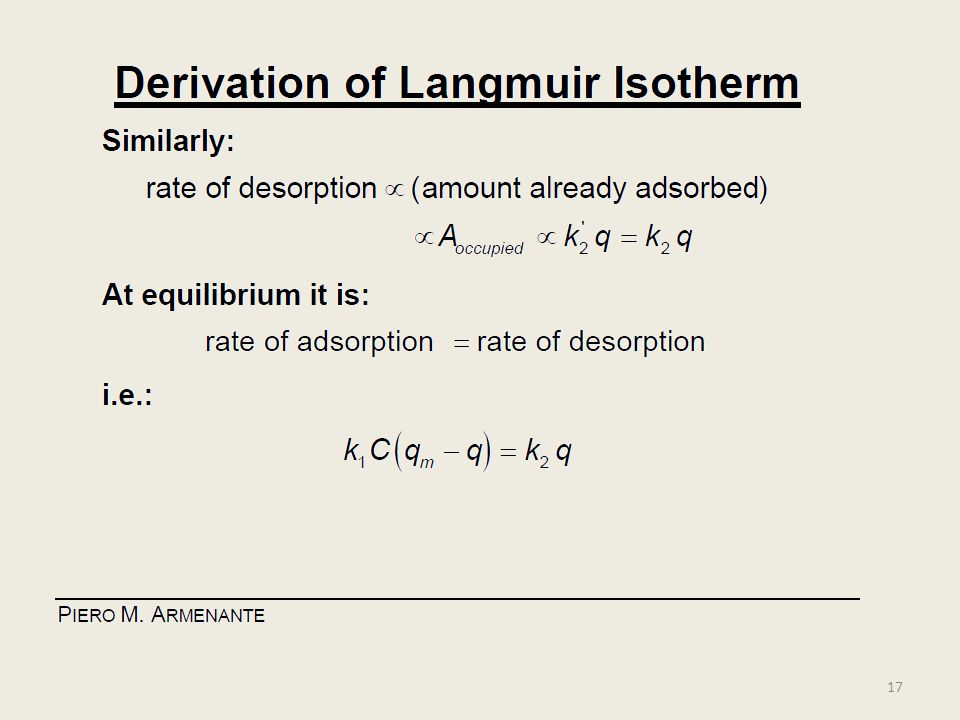
Isosteric heat of Adsorption
Enthalpy of Adsorption Heats of adsorption change as a function of surface coverage Van’t Hoff equation Isosteric heat of Adsorption Variations of ln p with 1/T is plotted. It shows that the slope of the supposed straight lines is negative thus the isosteric heat of adsorption takes positive values in this particular case.

10
Characterization of adsorption system
CH4003 Lecture Notes 13 (Erzeng Xue) Characterization of adsorption system Adsorption isotherm :The amount of adsorption as a function of pressure at set temperature Adsorption isobar :The amount of adsorption as a function of temperature at set pressure Adsorption Isostere : Adsorption pressure as a function of temperature at set volume Pressure Vol. adsorbed T1 T2 >T1 T3 >T2 T4 >T3 T5 >T4 Temperature P1 P2>P1 P3>P2 P4>P3 V2>V1 V1 V3>V2 V4>V3 Adsorption Isotherm Adsorption Isobar Adsorption Isostere 10
 Characterization of adsorption system. Adsorption isotherm :The amount of adsorption as a function of pressure at set temperature. Adsorption isobar :The amount of adsorption as a function of temperature at set pressure. Adsorption Isostere : Adsorption pressure as a function of temperature at set volume. Pressure. Vol. adsorbed. T1. T2 >T1. T3 >T2. T4 >T3. T5 >T4. Temperature. P1. P2>P1. P3>P2. P4>P3. V2>V1. V1. V3>V2. V4>V3. Adsorption Isotherm. Adsorption Isobar. Adsorption Isostere. 10.")
11
ADSORPTION EQUILIBRIA
If the adsorbent and adsorbate are contacted long enough , an equilibrium will be established between the amount of adsorbate adsorbed and the amount of adsorbate in solution. The equilibrium relationship is described by isotherms.

12
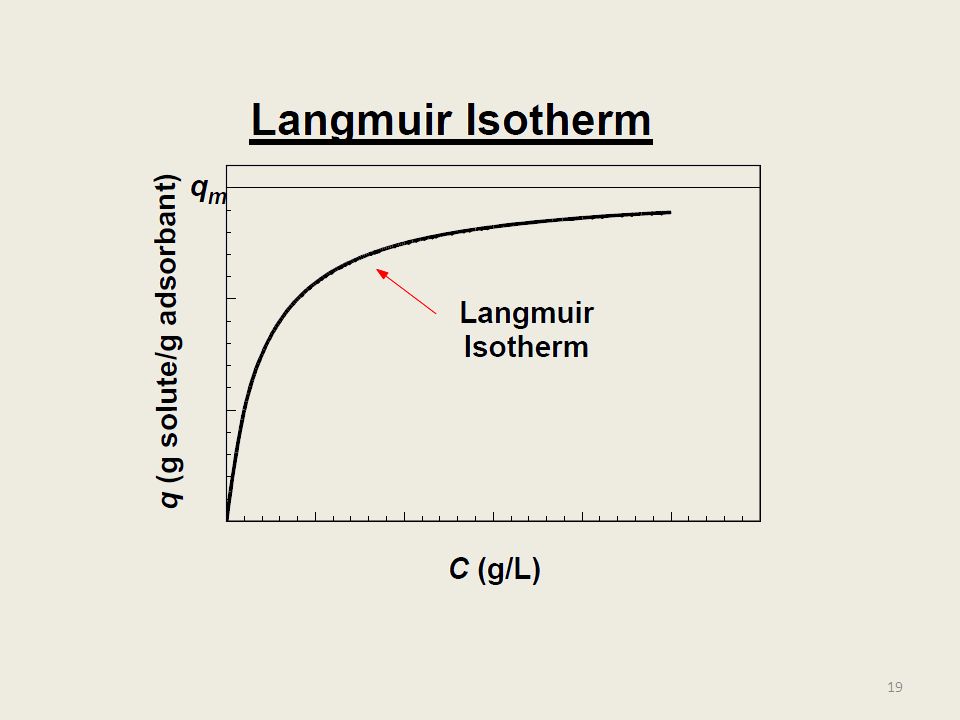
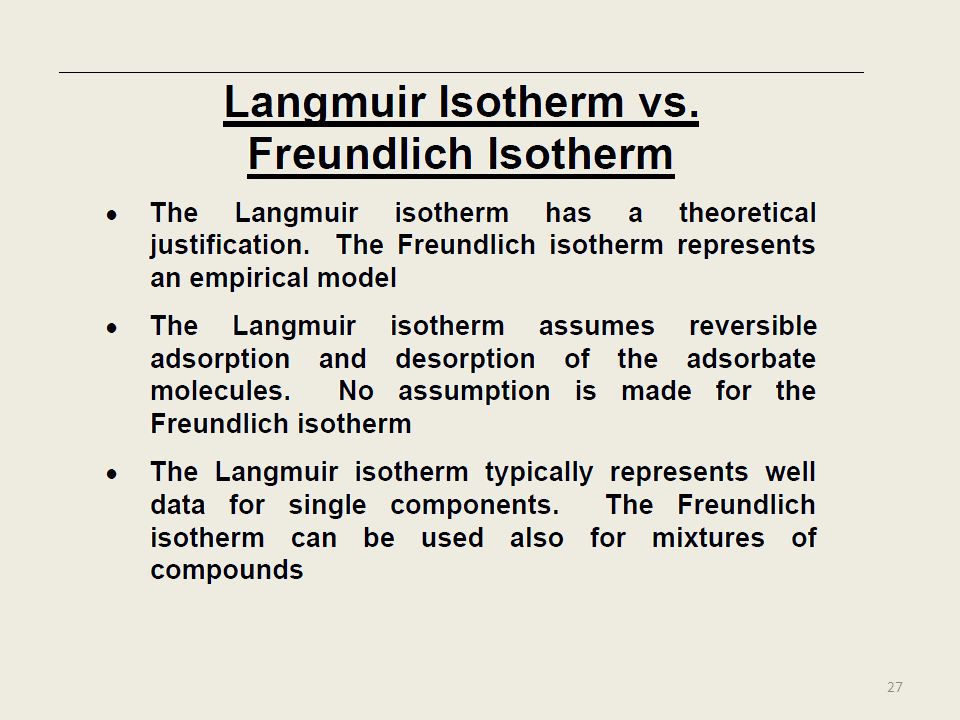
What is Adsorption Isotherm?
It is the graph between the amounts of adsorbate (x) adsorbed on the surface of adsorbent (m) and pressure at constant temperature. Different adsorption isotherms have been Freundlich, Langmuir and BET theory. The isotherm is useful in determining the interactions between the adsorbate and the adsorbent.
 adsorbed on the surface of adsorbent (m) and pressure at constant temperature. Different adsorption isotherms have been Freundlich, Langmuir and BET theory. The isotherm is useful in determining the interactions between the adsorbate and the adsorbent.")
14
Isotherm models: The figures next shows that there are four common models for isotherms.

22
The assumptions made in the derivation of the Langmuir model are :
Adsorption is a reversible process The adsorbed layer is made up of a single layer of molecules (Adsorption proceeds to monolayer formation only). The adsorbed molecules do not move on the surface of the adsorbent. The enthalpy of adsorption is the same for all molecules independently of how many have been adsorbed All sites are equivalent and the surface is uniform
. The adsorbed molecules do not move on the surface of the adsorbent. The enthalpy of adsorption is the same for all molecules independently of how many have been adsorbed. All sites are equivalent and the surface is uniform.")
28
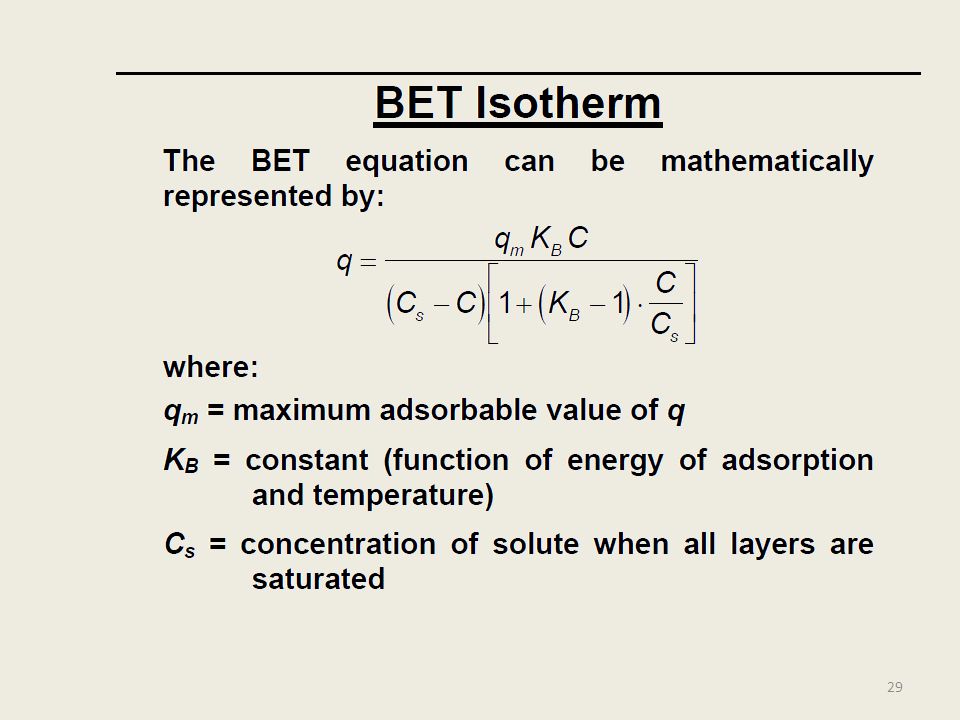
Brunauer, Emmett & Teller extends the Langmuir isotherm model to multilayer adsorption

33
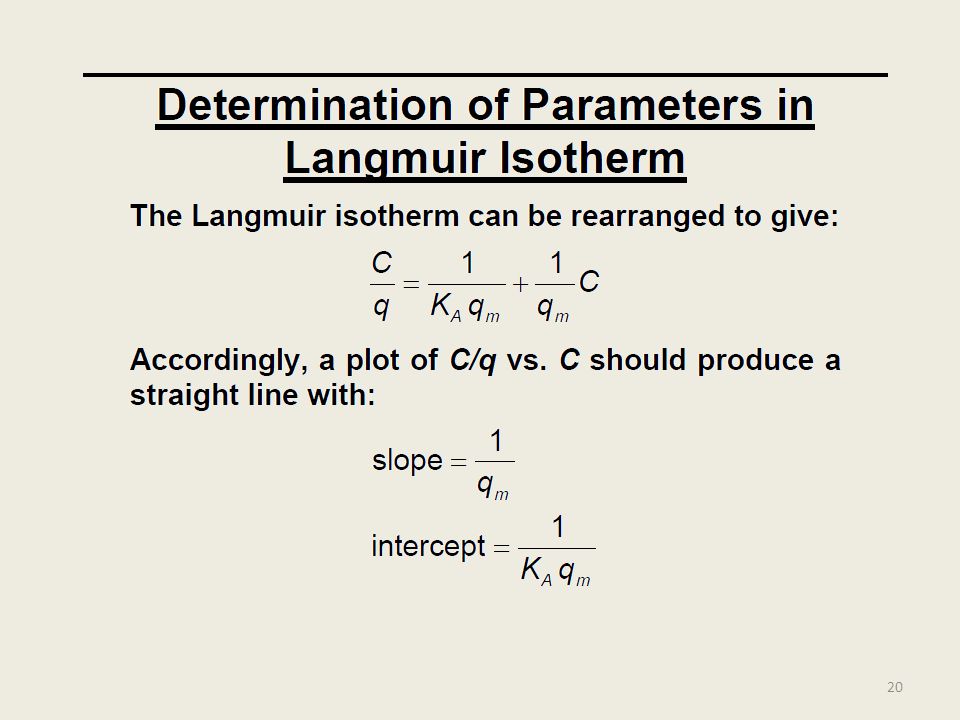
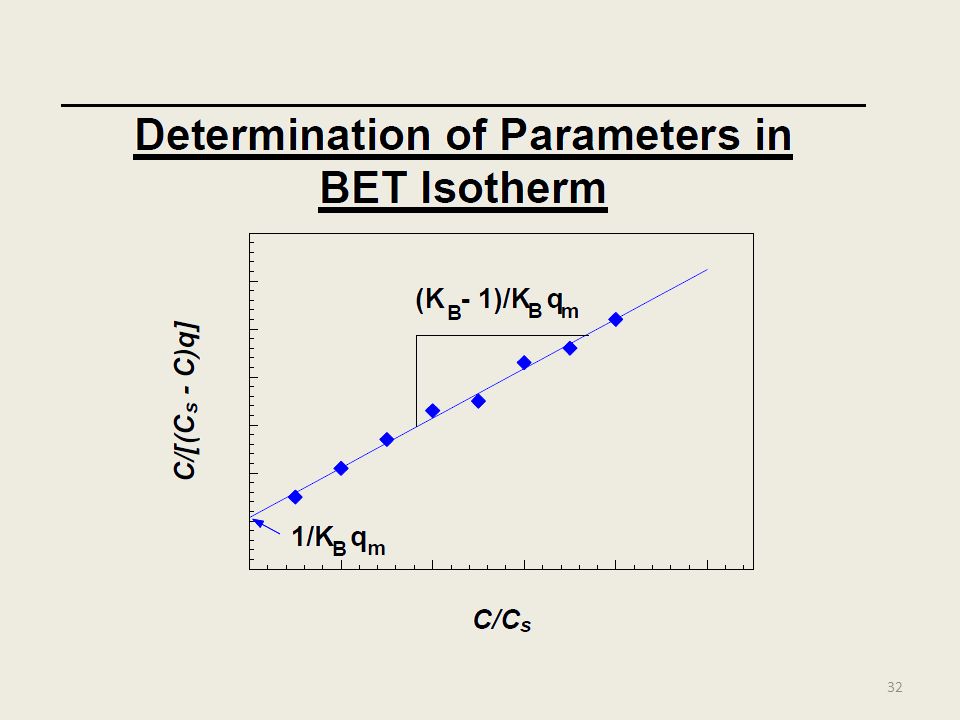
Determination of appropriate model:
To determine which model to use to describe the adsorption for a particular adsorbent/adsorbate isotherms experiments are usually run. Data from these isotherm experiments are then analyzed using the following methods that are based on linearization of the models.

34
Adsorption of methane molecules on/in open ended single-walled carbon nanotubes (o-SWCNT) is studied using molecular dynamics simulation.
 is studied using molecular dynamics simulation.")
35
METHOD MD calculations are carried out in the NVT ensemble by a new code written in the FORTRAN77 software environment. Both carbon atoms and methane molecules are treated as spherical rigid bodies. Pairwise interactions between fluid-fluid and fluid-surface are modeled with Leonard-Jones potential. The energy and size parameters of the LJ potential are εf = K, σf =3.81 Å for methane-methane interactions and εf =28 K, σf =3.35 Å for carbon-carbon interactions Lorentz-Bertholet combining rule is used for estimation of fluid-surface interactions in this form A perfect SWCNT with opened ends, is chosen as adsorbent.

36
The initial configuration of methane molecules has been organized according to the fccstructure with its 4 𝑴 𝟑 (M = 2,3,4,5,...) lattice points. Our code incorporated an important section through which all overlaps between methane molecules and surface were eliminated until the maximum distance between fluid molecules and SWCNT is less than 0.8σsf . Satisfying the principle of total momentum conservation and initial angular momentums were taken as zeroes, so the momentum conservation rule becomes:

37
Fig.1 : Computer-generated image of a SWCNT.
This fig. shows our substrate (adsorbent) enclosed by a fictitious cubic box.
 enclosed by a fictitious cubic box.")
38
Thermostatis used to rescale the velocities for fixing the kinetic temperature of the system. The way is that at each time step the velocities are multiplied by a factor of (T/Tcurr) 1/2 , where T is the desired thermodynamic temperature and Tcurr is the current kinetic temperature. The 3-D periodic boundary conditions were imposed on methane molecules so as to vanish the surface effect of the box faces. The LJ potential model is truncated for the Vander Waals cutoff that is chosen 12.8 Å.

39
The system is equilibrated and the ensemble averages of properties of interest are evaluated and stored during simulation. The relaxation of initial configuration to equilibrium evolves time steps. We optimized the integration time, the main section, of our program and could proceed the simulation procedure to long times. This action gives us results that are more reliable. The equations of motion in the form of Hamiltonian are integrated by the Verlet’s algorithm when the time step is short enough as 1 fs .

40
Convergence history for dimensionless total/potential energy during simulation of 500 methane molecule until time steps (20 ps) is shown in Fig.2 . For a specified simulation , dimensionless pressure and temperature should be hold constantly although they change frequently around their setting values Fig.3 .

41
Fig.2: Convergence history of dimensionless energy during simulation of 500 methane molecules.

42
Fig.3: Convergence history of dimensionless temperature and pressure for simulation of 500 methane molecules.

43
RESULTS AND DISCUSSION
Monolayer coverage on o-SWCNT This fact has been recognized that methane is weakly adsorbed on/in CNTs even under very high pressure (i.e. the interaction between methane-CNT is of small degree of magnitude). Results show at low pressure, a symmetrical monolayer of methane molecules is constituted around and inside of CNT. When the pressure increases, the second, third, fourth and higher layers are formed around CNT successively, while inside of CNT there is only one layer. The pressure increase is equivalent to increase in methane molecules in the box.
. Results show at low pressure, a symmetrical monolayer of methane molecules is constituted around and inside of CNT. When the pressure increases, the second, third, fourth and higher layers are formed around CNT successively, while inside of CNT there is only one layer. The pressure increase is equivalent to increase in methane molecules in the box.")
44
Fig.4 : Two dimensional snapshots of (a) initial (fcc) and (b) equilibrium configurations.
 initial (fcc) and (b) equilibrium configurations.")
45
Surface coverage of methane adsorption is expressed in terms of atomic ratio of adsorbed methane to carbon. Nmethane stands for the number of methane molecules adsorbed on the substrate. Where : Surface coverage at four different temperatures is calculated under several pressures, as one can see in Fig.5. The average pressure is integrated over its instantaneous values divided to the number of time steps.

46
Fig.5 : Coverage of methane adsorption on the external and internal surface of the o-SWCNT at different temperatures.

47
under consideration layer .
Investigation of models In this section, some of typical adsorption models whether theoretical or experimental, namely Langmuir, Sips, Freundlich and Langmuir-Sips, are correlated with the simulation data. For instance, the hybrid isotherm of Langmuir-Sips is defined beneath: Eq.1 Where : θ, the fractional coverage, is the ratio of unsaturated coverage to the full capacity of under consideration layer . p is the mean pressure of the system. Subscripts L and S denote on their belonging to the Langmuir and Sips equation, respectively. The parameters b, n and qm at specified temperature are constant values having only material dependency.

48
Fig. 6 : Correlation between common models and simulation data at 70 K
Fig.6 : Correlation between common models and simulation data at 70 K. The values of R 𝟐 for Langmuir, Freundlich, Sips and hybrid isotherms are 0.939, 0.802, and 0.992, respectively.

49
Our attention will be focused on this isotherm because of its high accuracy. Four parameters of the hybrid model were determined by a nonlinear least squares fitting routine of the Nelder-Mead simplex method done in MATLAB software curve fitting toolbox environment. Adjusted R 𝟐 is calculated for fit plots as a criterion of precision. To better understanding the coverage behavior at different temperatures, the fitting procedure was continued, unceasingly. A comprehensive report of the outcome of the fitting is incorporated in Table.1. It is observable from Table.1 that all parameters change with temperature, erratically. The temperature functionality of the parameters will be unknown in that the number of data point is poor, so the curve fitting is inappropriate.

50
The only way of finding the parameters should be the interpolation between the present data. The temperature dependency of bL or bs is hypothetically presented by this equation Eq.2 Where b0 , R and Eads are pre-exponential factor, universal gas constant and activation energy of adsorption respectively. This Equation is valid for Langmuir or Sips equation, separately, but in combination, the separation contributions of Langmuir and Sips are not obvious. We found that Table.1 and the data therein do not satisfy Eq.2 anyway. This fact is good evidence to previous claim about unknown relation between Eq.1 and Eq.2 . The thought is the essence of Eq.1 probably is different from its composer equations such as Langmuir or Sips.

51
TABLE1: THE PARAMETERS OF LANGMUIR-SIPS EQUATION (EQ
TABLE1: THE PARAMETERS OF LANGMUIR-SIPS EQUATION (EQ.1) IN VARIOUS TEMPERATURES.
 IN VARIOUS TEMPERATURES.")
52
C. Isosteric heat : The knowledge of this isosteric heat is essential in the study of adsorption kinetics. The isosteric heat may or may not vary with loading. It can be determined from the slope of the plot of ln p versus 1/T for a fixed amount of gas adsorbed on the substrate and is given by Eq.3. where p is the pressure corresponding to the surface excess concentration. It is better to measure more than two isotherms at different temperatures which are not too far apart (a separation of 10K is good) and then plot the isosteres (ln p versus 1/T) to check for linearity. Variations of ln p with 1/T is plotted. It shows that the slope of the supposed straight lines is unexceptionably negative thus the isosteric heat of adsorption takes positive values in this particular case. The quantity obtained by this method is sometimes called the isosteric heat, to indicate that it has been determined by the isosteric method.
 and then plot the isosteres (ln p versus 1/T) to check for linearity. Variations of ln p with 1/T is plotted. It shows that the slope of the supposed straight lines is unexceptionably negative thus the isosteric heat of adsorption takes positive values in this particular case. The quantity obtained by this method is sometimes called the isosteric heat, to indicate that it has been determined by the isosteric method.")
53
D. Multilayer coverage on o-SWCNT
Multilayer adsorption shows different behavior from the monolayer adsorption due to additional affecting phenomena like capillary condensation, layers overlapping and etc. From this view point, tracing adsorbate molecules in a multilayer adsorption will be difficult. The fact that a specified molecule through which layer is adsorbed, takes much effort than when just a monolayer for adsorption exists. Generally, the adsorption capacity increases from first layer to second layer and so forth . Fig.7 : Coverage of multilayer methane adsorption on the external and internal surface of the o-SWCNT at 70 K. .

54
Fig.8 : Total coverage of multilayer methane adsorption at 70 K.

55
E. Investigation of models for multilayer
TABLE 2. THE PARAMETERS OF LANGMUIR-SIPS EQUATION (EQ.1) IN VARIOUS TEMPERATURES FOR MULTILAYER ADSORPTION
 IN VARIOUS TEMPERATURES FOR MULTILAYER ADSORPTION.")
56
Fig.9 : Correlation between common models and simulation data at 70 K.

57
CONCLUSION Methane adsorption on/in SWCNTs is studied at different temperatures as well as pressures. We see that MD simulations can be employed to study such adsorption processes by applying canonical ensemble with the assumption that methane molecules were treated as rigid bodies . Surface coverage for both internal and external monolayer is directly calculated. As a result, surface coverage increases with pressure increase while decrease with temperature increase . It was found that the Langmuir-Sips model is best correlated to simulation data.The parameters of the Langmuir-Sips model are obtained via fitting on the simulation data . Quantities such as isosteric heat of adsorption and adsorption capacity were studied and it is found that the former quantity increases firstly with increase in amount of coverage and decreases, afterwards .

58
Multilayer data of adsorption shows good agreement with that produced by hybrid isotherm . Capillary condensation for multilayer adsorption was studied and it was shown that the internal space of SWCNT does not allow adsorbate to form capillary condensation because of space prohibition . This phenomenon occurs only at low temperatures on the meso pores , in which micro and macro pores are not capable of supporting such phenomenon .

59
THANK YOU

Similar presentations


>")


 first edition: p. 493-502.>")

 in contact with an.>")


