Download presentation
Presentation is loading. Please wait.

1
Interannual Variations in Methane Emissions and Net Ecosystem Exchange in a Temperate Peatland 2000-2004 Claire Treat Mount Holyoke College Research and Discover Program Dr. Ruth Varner UNH, advisor

2
Background: Carbon, Peatlands, and Global Climate Change Climate change may have a large impact on carbon storage in peatlands – Peatlands contain about 30% of the global pool of soil carbon – Loss of soil C will be a positive feedback to climate change – C storage will be a negative feedback Net C loss or uptake of a site can be determined by measuring the Net Ecosystem CO 2 Exchange (NEE) NEE of an ecosystem is the difference between two large components: Photosynthesis and respiration.
 NEE of an ecosystem is the difference between two large components: Photosynthesis and respiration.")
3
Methane’s Role in the Carbon Cycle Methane is a greenhouse gas Sources: – Wetlands are the largest single source – Total anthropogenic sources are 2x larger than natural sources (Prather et al. 1995) Sinks: – Reaction with OH radicals in the atmosphere – Oxidation in soil
 Sinks: – Reaction with OH radicals in the atmosphere – Oxidation in soil.")
4
Wetlands, Methane, and NEE From Christensen 2003 Methane fluxes: – Positive correlation with CO 2 fixation (Joabsson 2001) – Strong correlation with average seasonal NEE (Bellisario 1999) – Enhanced by vascular plants Substrate production Transport (King 1998, Bellisario 1999, Van den Pol-Van Dasselaar 1999)
 – Strong correlation with average seasonal NEE (Bellisario 1999) – Enhanced by vascular plants Substrate production Transport (King 1998, Bellisario 1999, Van den Pol-Van Dasselaar 1999)")
5
Research Questions How do NEE and methane emissions vary within one growing season? How do NEE and methane emissions vary interannually? What are the relationships between NEE and methane emissions? Is it possible to predict methane fluxes from instantaneous NEE? What are the environmental controls on NEE and CH 4 ?

6
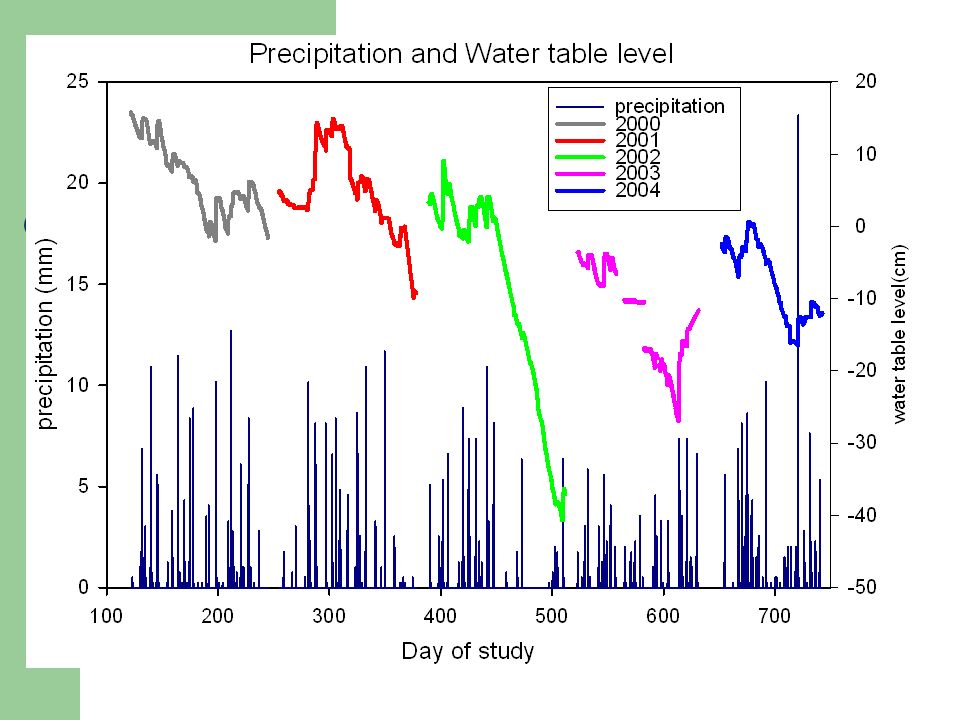
Why look at Sallie’s Fen? 15 years of CH 4 and respiration measurements 5+ years of NEE measurements Simultaneous NEE and CH 4 measurements Continuous meteorological data Continuous water table data from 1987

7
Taking a look at Sallie’s Fen… Barrington, NH Temperate poor fen located in South Eastern New Hampshire (43 12.5’N, 71 3.5’W) Small (1.7 ha) Peat depth of 2-4.5m Receives mean annual precipitation= 1100 mm Mean annual temperature= 8.1 C Mean growing season T=14.9 C Biologically active season from April-October Sphagnum dominated Other important species are leatherleaf, blueberry, sedge
 Small (1.7 ha) Peat depth of 2-4.5m Receives mean annual precipitation= 1100 mm Mean annual temperature= 8.1 C Mean growing season T=14.9 C Biologically active season from April-October Sphagnum dominated Other important species are leatherleaf, blueberry, sedge")
8
Methods Measuring NEE – Calculated CO 2 flux using IRGA – Photosynthesis= NEE - Resp. Measuring CH 4 – Samples taken during respiration measurements – Analyzed on a gas chromatograph

9
Results NEE and CH 4 data from 1 May-31 August for the years 2000 to 2004 were used NEE data is measured with PAR>1000 NEE measurements with an avg. RH>80 were discarded CH 4 fluxes with r 2 <0.75 were excluded

10
How does NEE vary throughout the season?

11
How do the components of NEE change throughout the summer season?

12
How do CH 4 fluxes change throughout summer?

14
20002002200320042001

15
How does NEE vary interannually?

16
How do CH 4 fluxes vary interannually?

17
How are CH 4 emissions related to the magnitude of NEE? r 2 =0.22 r 2 =0.73 r 2 =0.29 r 2 =0.27

18
How are photosynthesis and methane fluxes related? r 2 =0.68 r 2 =0.40r 2 =0.44

19
How are methane fluxes related to respiration? r 2 =0.40

20
Conclusions NEE, photosynthesis and respiration all increase in magnitude during the summer, and decrease as senescence begins Magnitude and variability of CH 4 fluxes increase over the growing season C exchange due to NEE is >> in magnitude than than C exchange from methane emissions CH 4 fluxes from the early summer are consistent between years CH 4 fluxes are controlled by episodic events which determine the net C emission CH 4 fluxes are related to the components of NEE – Positive relationship with photosynthesis in all years This suggests that plants are an important control on CH 4 emissions – Positive relationship with respiration This suggests similar control on belowground processes

21
Future research & senior honors thesis at MHC Determine the dominant controls on the interannual variability of NEE and CH 4 fluxes through statistical analysis Compare monthly and seasonal averages of NEE, CH 4 between years and within seasons Determine if CH 4 is related to NEE on monthly and seasonal averages Further determine the effects of water table level, peat temperature, species composition on NEE and CH 4 fluxes

22
Acknowledgements Thanks to: Dr. Ruth Varner, UNH Dr. Jill Bubier, MHC Dr. Steve Frolking, UNH Dr. George Hurtt NASA/UNH R&D Lisa Brunie, MHC Tess Finnigan-Allen, UNH Maria Hunter Kate Petzack

Similar presentations


>")


 Chris Huntingford,>")


 (mm) 2005 15.6/5.1 300/730 2006 17.3/5.5 160/660 2007 16.0/5.7 210/730 2008 14.8/6.2 270/810 Jun-Aug/annual mean.>")

Have you develop a firm understanding of the concepts and mechanisms of ecosystem ecology; 2)Have you enhance your understanding of how.>")


. Plants take in carbon dioxide and lose water vapor through small pores in their leaves called stomata.>")


