Download presentation
Presentation is loading. Please wait.

1
LOGIC MODEL: A Program Performance Framework Oklahoma State University Stillwater, OK

2
OCES Program Planning OCES works within broad program guidelines. Long Range Plan of Work Rolling Plan of Work Typically 3 years or more, but is flexible Short term Planning to Accomplish Longer Term Goals Annual Implementation Timeline This is your roadmap

3
What is a Logic Model? A simplified picture of a program, initiative or intervention in response to a given situation. Shows the logical relationships among the resources that are invested, the activities that take place and the benefits or changes that result. Some call this ‘program theory’ Logic modeling is really a way of thinking! A bridge between where you are and where you want to be with your programs.

4
What is a Logic Model? A systematic and visual way (road map) to present and share your understanding of the relationships among: Resources you have to operate your program The activities (timeline) you plan to do The changes or results you hope to achieve It’s a map of how you think your program will work from start to finish.
 to present and share your understanding of the relationships among: Resources you have to operate your program The activities (timeline) you plan to do The changes or results you hope to achieve It’s a map of how you think your program will work from start to finish..")
5
LOGIC If you don’t know where you’re going, how are you gonna know when you get there? Yogi Berra

6
Brief History Logic Models Aren’t New Date back to the 1970s Suchman (1967), Weiss (1973), Bennett (1976), others Used Many Places: Private Sector Public Sector Govt. Performance Results Act 1993 Set Standards for Measuring Performance Non-Profit Sector such as United Way International Donor Agencies Evaluators

7
Goals for Today Learn about LOGIC Models A basic introduction to the logic model as an action-oriented tool for program planning and evaluation Practical Applications of LOGIC Models in your programs

8
WHY LOGIC MODELS? Shows difference between what we do and impact we are having Provides a common vocabulary Focus on quality and continuous improvement

9
Logic Model Common Vocabulary SITUATIONSITUATION OUTCOMESINPUTSOUTPUTS Government reports, OCES reports, Grant applications

10
HEADACHEHEADACHE Feel betterGet pillsTake pills Everyday Logic Model Logical progression, common sense

11
HUNGERHUNGER Feel betterFind FoodEat Food Everyday Logic Model Logical progression, common sense

12
Logic Model OCES Logic Models will be somewhat more complicated, but remembering the simple examples should keep them from becoming overwhelming or intimidating.

13
INPUTS Specialists Educators Clerical Staff Money Time Volunteers Partners Equipment Technology

14
OUTPUTS What we do Who we reach ACTIVITIES Workshops Counseling(Office, On- Farm, Home, etc.) On-farm research Facilitation Product development Curriculum design Trainings Field days Conferences Media PARTICIPATION Participants Clients Customers Users
 On-farm research Facilitation Product development Curriculum design Trainings Field days Conferences Media PARTICIPATION Participants Clients Customers Users")
15
OUTCOMES What happened? LEARN Knowledge gain ACT Implement best practices EFFECT Change in condition

16
LOGIC MODEL: Program Performance INPUTSOUTPUTSOUTCOMES Program investments ActivitiesParticipationShortMedium What we invest What we do Who we reach What results Long- term

17
IF : THEN The IF:THEN relationship provides for the development of the LOGIC MODEL. The Logic MODEL is important to OCES because NIFA’s federal Plan of Work is designed around it. So…Logic tells us the Logic Model is important at the local level.

18
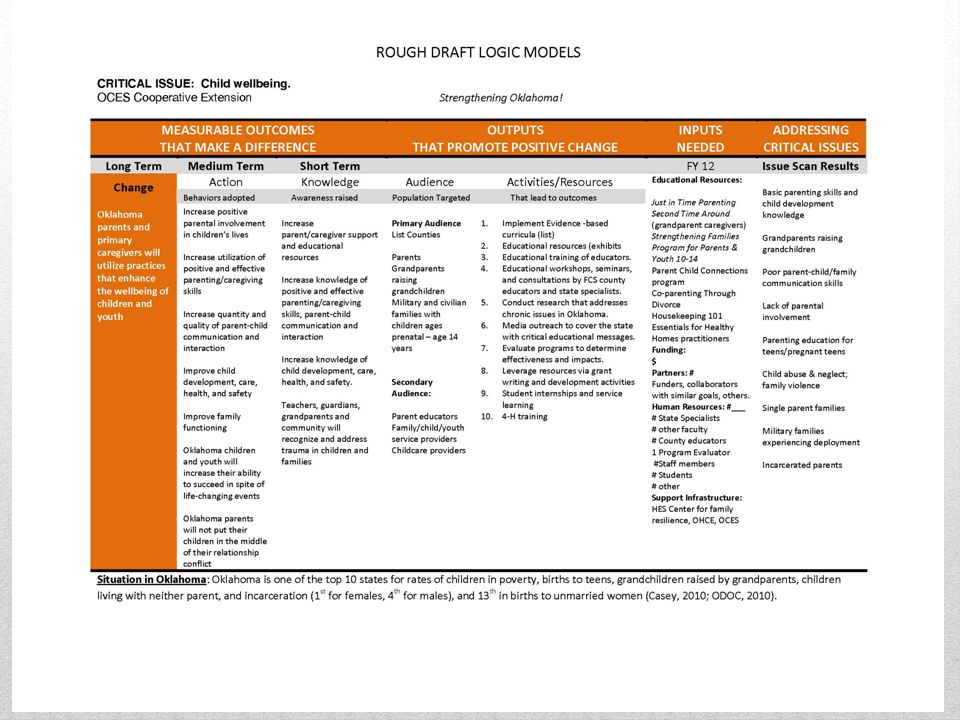
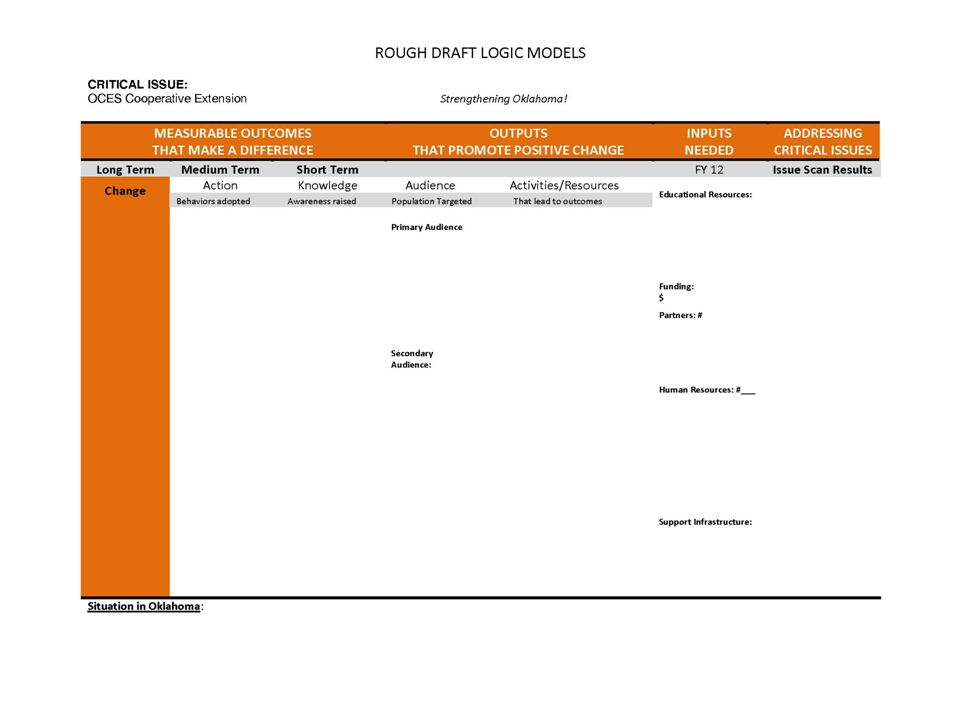
LOGIC MODEL: Program Performance Framework

19
Do the Outcomes First I definitely advocate doing the outcomes first! I find that people come up with much more effective activities when they do. Use the motto, “ plan backward, implement forward.” Beverly Anderson Parsons, WKKF Cluster Evaluator

20
OUTCOMESINPUTSOUTPUTS ActivitiesParticipation ShortMediumLong term Programmatic investments i Implement and Evaluate PLANNING

21
Outcomes Are they Important? Are they Reasonable? Are they Realistic? Are there Negative Consequences? Specific Measurable Attainable Realistic Timed

22
Staff Money Partners Develop parent ed curriculum Deliver 6 interactive sessions Targeted parents attend Parents increase knowledge of child dev Parents learn new ways to discipline Parents use improved parenting skills Reduced rates of child abuse & neglect INPUTSOUTPUTS OUTCOMES INDICATORS??? Research

23
INDICATORS: Examples #, % with savings goal set #, % with debt reduction goal set #, % using spending plan #, % maintaining emergency fund Improved family financial management #, % acres managed according to BMP guidelines Quality of conservation plan implementation Reduction in N and P application rates #, % of Boards with youth participation Increased youth-adult partnerships INDICATORSOUTCOME

24
OUTCOMES What results for individuals, businesses, communities..… SHORT Learning Awareness Knowledge Attitudes Skills Opinion Aspirations Motivation MEDIUM Action* Behavior Practice Decisions Policies Social action LONG-TERM Conditions* Human Economic Civic Environment *OALP Study, Wall 4-H Study, Foster

25
Progressive Outcome Relationships SHORTMEDIUMLONG-TERM Seniors increase knowledge of food contamination risks Practice safe cooling of food; food preparation guidelines Lowered incidence of food borne illness Participants increase knowledge and skills in financial management Establish financial goals, use spending plan Reduced debt and increased savings Community increases understanding of childcare needs Residents and employers discuss options and implement a plan Child care needs are met Empty inner city parking lot converted to community garden Youth and adults learn gardening skills, nutrition, food preparation and mgt. Money saved, nutrition improved, residents enjoy greater sense of community

26
Logic model with Indicators for Outputs and Outcomes Program implemented Targeted farmers Farmers learn Farmers practice new techniques Farm profitability increases Number of workshops held Number and percent of farmers attending Number and percent who learned content Number and percent who adopted practices Number and percent show improved farm profits; amount of increase Outputs Outcomes

27
Focus Levels of Outcomes Individua l Child, parent, client, resident Group family, team, community group Agency, organization System Community Child is prepared to enter school; teen uses savings/spending plan Community group has inclusive membership policy; family increases its savings Communications are more open; agency adopted smoke-free policy Family serving agencies share resources Shared community responsibility has increased; youth are valued as contributing members

28
Where Does Evaluation Fit? Decrease in rates - agency records Actual use - follow-up phone interview Increase in knowledge/skill - post session survey # parents attending/session which parents % of parents Quality of curriculum # of sessions delivered Staff Money Partners Design parent ed curriculum Provide 6 training sessions Targeted parents attend Parents increase knowledge of child dev Parents learn new ways to discipline Parents use improved parenting skills Reduced rates of child abuse & neglect INPUTSOUTPUTS OUTCOMES EVALUATION: What do you want to know? How will you know it?

31
Summary Think of the Logic Model as Your “Roadmap” to your own performance

32
Logic Model Websites http://www.uwex.edu/ces/lmcourse/ http://www.wkkf.org/Pubs/Tools/Evaluation/Pub3669.pdf http://www.uidaho.edu/extension/LogicModel.pdf Or goto google.com, search for “logic model program evaluation”

33
Questions???

Similar presentations


 756-2335 Goal Driven Logic Models.>")


