Download presentation
Presentation is loading. Please wait.

1
Net community production in the Southern Ocean Princeton collaborators: Nicolas Cassar, Melissa Hendricks, Kuan Huang, Bror Jonsson, Warren Joubert, Matt Reuer, Hiroaki Yamagishi Collaborators/hosts: Bronte Tilbrook (CSIRO, Hobart) and French/Australian Astrolabe time series study; Pedro Monteiro, CSIR, Cape Town, and SA Agulhas time series study; SAZ/SENSE process study; Bonus/Goodhope process study; Roberta Hamme and Southern Ocean GasEx process study Supported by: NSF OPP and NASA
 and French/Australian Astrolabe time series study; Pedro Monteiro, CSIR, Cape Town, and SA Agulhas time series study; SAZ/SENSE process study; Bonus/Goodhope process study; Roberta Hamme and Southern Ocean GasEx process study Supported by: NSF OPP and NASA")
2
Outline 1.Seasonal/annual NCP estimates for the entire basin (~ 2 mol m -2 yr -1 or 20 mmol m -2 day -1 for 100 day growing season) 2.Methods for constraining local NCP 3.Seasonal variations in NCP 4.Spatial variations in NCP; implications for controlling factors 5.Prospects for scaling NCP 6.Questions/suggestions Definition and premise NCP is the rate of O 2 or C org production by photosynthesis - consumption by respiration (and photooxidation) Domain is euphotic zone or mixed layer; not that different in Southern Ocean C org storage is modest, therefore NCP = POC export + DOC export
 2.Methods for constraining local NCP 3.Seasonal variations in NCP 4.Spatial variations in NCP; implications for controlling factors 5.Prospects for scaling NCP 6.Questions/suggestions Definition and premise NCP is the rate of O 2 or C org production by photosynthesis - consumption by respiration (and photooxidation) Domain is euphotic zone or mixed layer; not that different in Southern Ocean C org storage is modest, therefore NCP = POC export + DOC export")
3
1. Basin-scale estimates of Southern Ocean NCP Morrison et al. (2001) Seasonal nutrient drawdown along 170˚ W: 1.5-2.2 moles m -2 year -1 Lourey and Trull (2001) Seasonal nutrient drawdown S of Australia: SAZ, ~ 3; PFZ ~ 1.5 moles m -2 year -1 DiFiore et al. (2006) Seasonal nitrate drawdown using 15 NO 3 - change to account for advection, in SAZ: 3 moles m -2 year -1 Reuer et al. (2007) Air-sea O 2 fluxes supported by NCP at ~ 500 stations: ~ 2 moles m -2 year -1 Pollard et al. (2006), Seasonal upper ocean nutrient drawdown evaluated given Ekman flow: 2.7 moles m -2 year -1 S of 50˚ S Schlitzer (2002), subsurface nutrient additions evaluated using a GCM: ~ 2 moles m -2 year -1 Moore et al. (2004) Model euphotic zone NCP in S. Ocean that reproduces seasonal changes in atmopsheric O 2 /N 2 ratios: ~ 1.5 moles m -2 year -1
 Seasonal nutrient drawdown along 170˚ W: moles m -2 year -1 Lourey and Trull (2001) Seasonal nutrient drawdown S of Australia: SAZ, ~ 3; PFZ ~ 1.5 moles m -2 year -1 DiFiore et al. (2006) Seasonal nitrate drawdown using 15 NO 3 - change to account for advection, in SAZ: 3 moles m -2 year -1 Reuer et al. (2007) Air-sea O 2 fluxes supported by NCP at ~ 500 stations: ~ 2 moles m -2 year -1 Pollard et al. (2006), Seasonal upper ocean nutrient drawdown evaluated given Ekman flow: 2.7 moles m -2 year -1 S of 50˚ S Schlitzer (2002), subsurface nutrient additions evaluated using a GCM: ~ 2 moles m -2 year -1 Moore et al. (2004) Model euphotic zone NCP in S. Ocean that reproduces seasonal changes in atmopsheric O 2 /N 2 ratios: ~ 1.5 moles m -2 year -1.")
4
Nitrate drawdown and recycling of N remineralized below the euphotic zone NCP of 2 mol m -2 yr -1 corresponds to nitrate uptake/export of ~ 1-1.5x10 13 moles NO 3 - NO 3 - upwelled to surface ~ 10 Sv x 30 mmol m -3 = 10 13 moles/year –~ 1/2 of upwelled NO 3 - is lost by subduction –Net NO 3 - upwelling ~ 0.5 x 10 13 moles/year Subsurface water supply significant NO 3 - to the euphotic zone NO 3 - balance more complicated than simple removal during Ekman drift (Sigman, Sarmiento)
")
5
2. Methods for constraining short-term local NCP: the toolkit 15 NO 3 - uptake in incubated samples (accesses 1 day) ∆[O 2 ] in incubated samples (accesses 1 day) 234 Th deficiency and 234 Th/C ratios (accesses last month) Shallow sediment traps (accesses last week???) Sea surface biological O 2 supersaturation measurements + gas exchange velocity estimate (accesses last ~ 10 days) –Upwelling/vertical mixing can introduce O 2 -undersaturated waters –Gas exchange rate is uncertain –Temporal variability is averaged –Need to correct for physical supersaturation (Ar)
 ∆[O 2 ] in incubated samples (accesses 1 day) 234 Th deficiency and 234 Th/C ratios (accesses last month) Shallow sediment traps (accesses last week ) Sea surface biological O 2 supersaturation measurements + gas exchange velocity estimate (accesses last ~ 10 days) –Upwelling/vertical mixing can introduce O 2 -undersaturated waters –Gas exchange rate is uncertain –Temporal variability is averaged –Need to correct for physical supersaturation (Ar).")
6
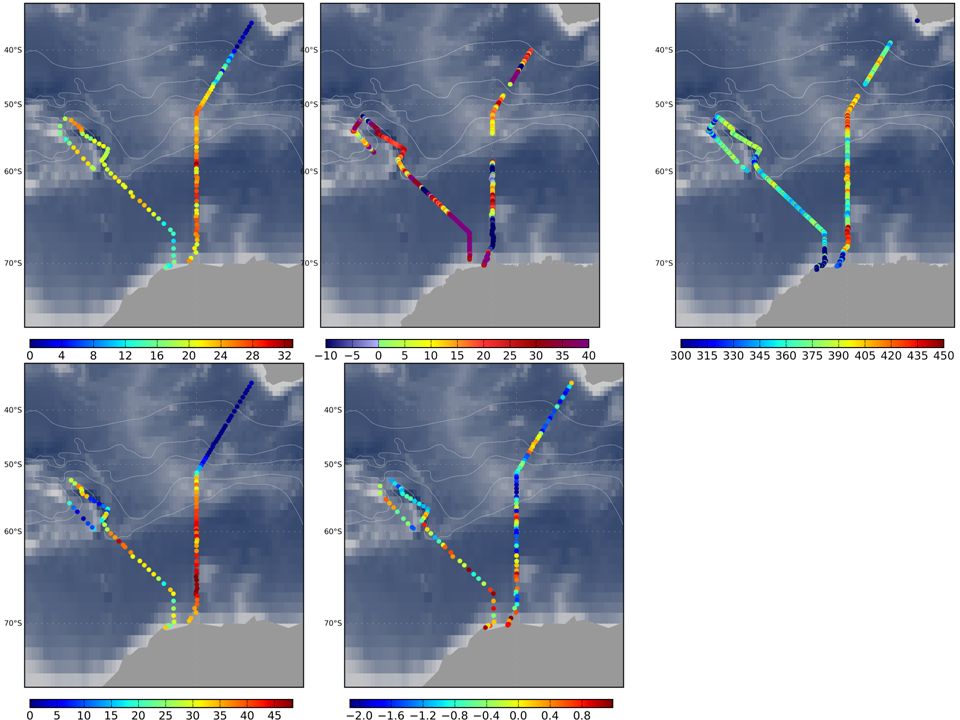
Hobart Dumont d’Urville Cape Town S. Georgia Is. SANAE Seasonal NCP mmol m -2 day -1

7
3. Seasonal variations in NCP Springtime rates are not exceptional End summer/fall rates appear to be lower than Dec./Jan. rates

8
3. Seasonal variations continued Summertime NCP is higher than springtime NCP between Hobart and Dumont d’Urville

9
3. Seasonal variations continued Between New Zealand and Ross Sea, NCP increases from November to December (Tortell and Long, 2009) ~Nov.5 ~Dec. 7
 ~Nov.5 ~Dec. 7.")
10
4a. Spatial variations in NCP: role of SiO 2 Hypothesis: diatoms dominate carbon export/NCP Prediction: NCP decreases northward in summer (not validated)
.")
11
SiO 2 and NCP from eastern Atlantic (Monteiro and Joubert, CSIR; Cassar) Productivity is high north of Polar front, even though SiO 2 is depleted 4a. Spatial variations in NCP: role of SiO 2

12
4b. Spatial variations in NCP: role of bathymetry Flow over topography supplies iron by inducing vertical turbulence, Shallow sea floor supplies iron directly

13
4c. Spatial variations: light limitation 1. Volumetric NCP decreases with z: de Baar 2. Depth-integrated NCP vs. MLD 3. SAZ south of Australia: NCP vs. MLD

14
5a. Prospects for scaling: NCP vs. chl off Palmer Peninsula Is there a compact relationship between NCP and chl?

15
5b. Prospects for scaling - one possible strategy Start with –VGPM (~ 14 C production) from B+F: Depends on I, z eu, SST, chl –f ratio from Dunne et al.: Depends on SST, ln(VGPM/z eu ) Scale VGPM by MLD/euphotic zone depth Model NCP = f * scaled VGPM Compare with observations for SAZ-SENSE
 from B+F: Depends on I, z eu, SST, chl –f ratio from Dunne et al.: Depends on SST, ln(VGPM/z eu ) Scale VGPM by MLD/euphotic zone depth Model NCP = f * scaled VGPM Compare with observations for SAZ-SENSE.")
16
Summary Characterization of Southern Ocean NCP is progressing Southern Ocean NCP ~ 2 mol m -2 year -1, similar to other areas Temporal variations: somewhat higher in summer, no bloom in W. Pacific Spatial variations: –NCP highest in north, closest to iron sources –SiO 2 not needed for high NCP –Evidence for light limitation (SAZ, Palmer Peninsula) –Some evidence for NCP changes across bathymetry and/or fronts Some hope for scaling NCP from frequently observed properties
 –Some evidence for NCP changes across bathymetry and/or fronts Some hope for scaling NCP from frequently observed properties.")
17
3 questions Overall objectives of biogeochemical studies –Characterize ecosystems of one of Earth’s great domains –Understand the present and coming influence of the biota on sea surface pCO 2 –Understand the influence of the biota on the nutrient burden of subducted AABW, AAIW, and SAMW Contributions of experimental biogeochemistry –Characterize the autotrophic community –Understand the role of heterotrophs in mediating carbon export –Understand the remineralization scale length Research strategies –Autotrophy: ships of opportunity –Euphotic zone heterotrophy and remineralization scale length: dedicated process cruises –All supplemented by autonomous platforms

19
4d: Are there pools of more and less fertile waters? NCP - PCO 2 relationships, and the history of productivity Latitude NCP CO 2 NCP CO 2 Latitude NCP CO 2 0 a. Productivity is high, then diminishes c. Productivity is high throughout growing season b. Productivity is low throughout growing season 0 CO 2 and NCP vs. lat. South of Cape Town

20
Determining net community production in the mixed layer Net community O 2 production = flux to atmosphere Complication: [O 2 ] > [O 2 ] sat because of warming and bubble entrainment Measure Ar as inert analog to O 2 to correct for physical supersaturation (Jenkins, Craig, Quay, Emerson, Luz, Stanley, Hamme…) O 2 /Ar can be measured on samples returned to the lab O 2 /Ar can be measured continuously using membrane inlet mass spectrometry (Kaiser, Tortell) or equilibrator inlet mass spec (Cassar) CO 2 + H 2 O --> CH 2 O + O 2 CH 2 O + O 2 --> CO 2 + H 2 O Photosynthesis Respiration P - R = O 2 NCP = O 2 efflux to atmosphere = ([O 2 ] - [O 2 ] sat ) * gas exch. velocity Base of the mixed layer
![Determining net community production in the mixed layer Net community O 2 production = flux to atmosphere Complication: [O 2 ] > [O 2 ] sat because of warming and bubble entrainment Measure Ar as inert analog to O 2 to correct for physical supersaturation (Jenkins, Craig, Quay, Emerson, Luz, Stanley, Hamme…) O 2 /Ar can be measured on samples returned to the lab O 2 /Ar can be measured continuously using membrane inlet mass spectrometry (Kaiser, Tortell) or equilibrator inlet mass spec (Cassar) CO 2 + H 2 O --> CH 2 O + O 2 CH 2 O + O 2 --> CO 2 + H 2 O Photosynthesis Respiration P - R = O 2 NCP = O 2 efflux to atmosphere = ([O 2 ] - [O 2 ] sat ) * gas exch.](http://images.slideplayer.com/37/10679257/slides/slide_20.jpg "velocity Base of the mixed layer.")
Similar presentations


>")


. UK GEOTRACES: Characterizing nitrate isotopes in South Atlantic water.>")
, L. Merlivat (1) and K.>")


