Download presentation
Presentation is loading. Please wait.

1
2016 NRCS IMPLAN Updates David Buland, March 23, 2016

2
USDA has a department-wide IMPLAN License !!! Dr. Janet Perry has coordinated a USDA-wide license this year. Good for all USDA employees through 2016 Access to all IMPLAN data, including state, county, zip-code and congressional districts. USDA coordination is through David Buland and Mark Peters, NRCS. We need to justify usage to provide a Mark Peters coordinates a monthly USDA IMPLAN Users Conference.

3
FY2012 through FY2015 NRCS Programs Data REAP has provided FY data for all NRCS payments with contract level FY year data since 2012. This year’s data was available in January, and has been used in Arkansas, Tennessee, and Louisiana already this year. Will be used in Mississippi next week. Available for downloading at \\txfortworts601\Data2\DavidBuland\\txfortworts601\Data2\DavidBuland

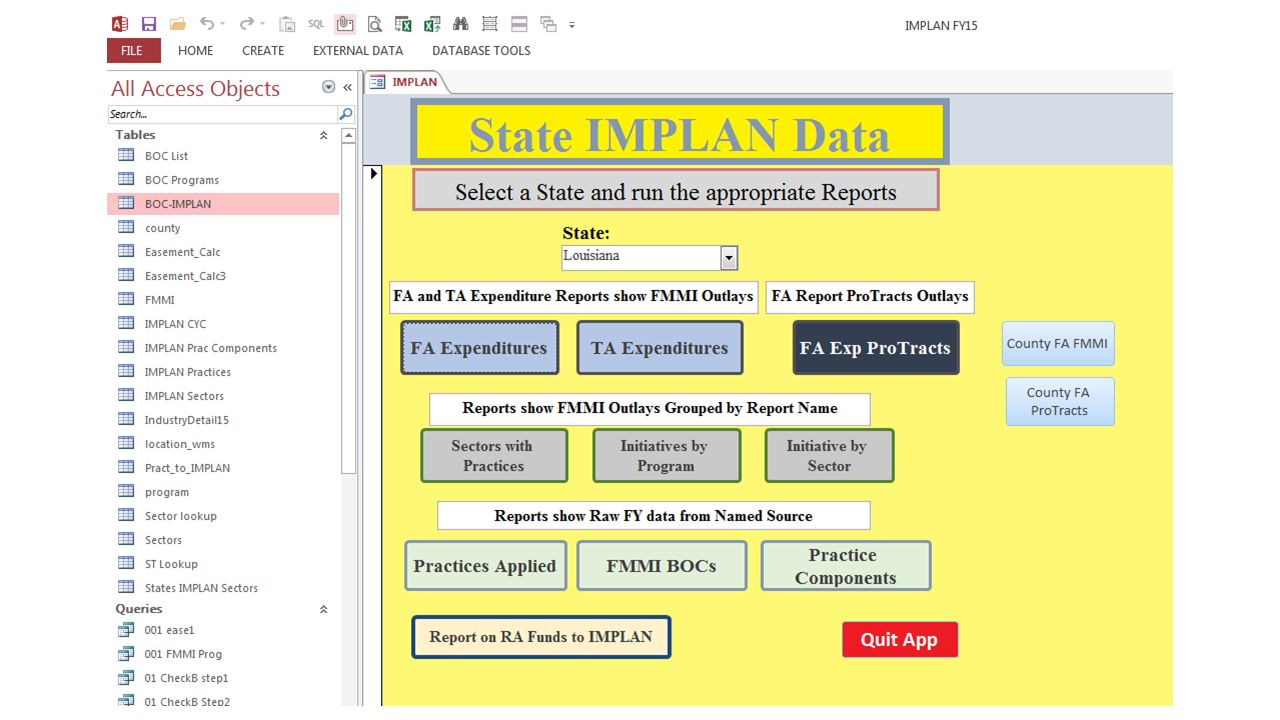
5
Basic State Analysis Procedure Output Data to a spreadsheet FA Expenditures by Program and IMPLAN Sector TA Expenditures by Program and IMPLAN Sector RA Expenditures by Program and IMPLAN Sector MissouriWHIP10$40,134.27All other crop farming MissouriWHIP15$50,615.72Forestry, forest products, and timber tract production MissouriWHIP19$48,916.91Support activities for agriculture and forestry MissouriWHIP3006$4,357.55Greenhouse, nursery, and floriculture products MissouriWHIP3248$622.68Spring and wire products MissouriWHIP5001$14,745.50Employee Compensation

6
Doublecheck the Program totals with the state staff. If the state staff have problems with the input numbers, they will never accept the output numbers. We used ProTracts data adjusted to match FMMI totals, but do check against the raw ProTracts data, and be able to explain the differences. Missouri FY2015 Outlays ProgramBOC Code TA Outlays FA Outlays FA ProTracts RA Outlays Totals% TA Agriculture Conservation Easement ProgramACEP $ 1,522,382 $ 3,047,243 $ 4,569,62533% Agriculture Water Enhancement Program AWEP $ -0% Conservation Operations Program COTA $ 16,370,756 $ 12,338 $ 16,383,094100% Conervation Reserve Program CRPG $ 1,970,299 $ 171,724 $ 2,142,02392% Conservation Security Program CSPG $ 291,197 $ 1,516,054 $ 1,518,506 $ 1,807,25116% Conservation Stewardship Program CSTP $ 7,547,117 $ 30,163,781 $ 29,185,686 $ 37,710,89820% EG05 $ - EG08 $ 708 $ 5,043 $ 5,750 EMG HURR KATRINA 05 EK05 $ -0% Environmental Quality Enhancement Program EQIP $ 5,544,579 $ 21,383,506 $ 21,737,803 $ 26,928,08521% Emergency Watershed Major Program EWMP $ 172,980 100% Flood Prevention Operations Program FPOP $ -0% Farmland Protection Program FRPP $ 383 100% Grassland Reserve Program GRPG $ 299 100% Ground Surface Water Conservation Program GSWC $ -0% HFRP $ - Plant Material Center Program PMCS $ 203,797 100% Resource Conservation Partnership Program RCPP $ - 0% Soil Survey Program SOIL $ 161,810 100% Small Watershed Rehab Program SWRP $ -0% Wildlife Habitat Incentive Program WHIP $ 37,269 $ 159,393 $ 161,552 $ 196,66119% Wetland Reserve Program WRPG $ 60,492 $ 1,839,549 $ 1,900,0413% Small Watershed Operations WSOP $ - $ 632,410 0% WFPO Recovery Act WSOR $ -0% Waterbank Program WSRP $ -0% Watershed Rehab Recovery Program WSRR $ -0% Grand Total $ 33,884,067 $ 58,746,979 $ 52,603,547 $ 184,062 $ 92,815,10837%

7
Run the IMPLAN Analysis for each Program

8
Run the analysis by Program

9
Easement Payments are divided to eight categories based on surveys by American Farmland Trust of how Farmland Protrection Reserve Program recipients spend their easement payments. Division table for Easement Payments DescriptionIMPLAN_SectorPercentageIMPLAN Description Easements (ACEP, WRP, GRP, FRPP)150060.168Business Transfers, paying off Easement land,, not used in IMPLAN Easements (ACEP, WRP, GRP, FRPP)150060.142Business Transfers, paying off other farm land,, not used in IMPLAN Easements (ACEP, WRP, GRP, FRPP)150120.232Savings (Surplus), not used in IMPLAN Easements (ACEP, WRP, GRP, FRPP)150270.042Personal Tax: Income Tax, not used in IMPLAN Easements (ACEP, WRP, GRP, FRPP)100070.141Households 75-100k Spending Pattern, basic extra spending Easements (ACEP, WRP, GRP, FRPP)570.072Construction of new commercial structures, including farm structures Easements (ACEP, WRP, GRP, FRPP)32620.074Farm machinery and equipment Easements (ACEP, WRP, GRP, FRPP)190.129Support activities for agriculture and forestry, other farm expenditures
 Business Transfers, paying off Easement land,, not used in IMPLAN Easements (ACEP, WRP, GRP, FRPP) Business Transfers, paying off other farm land,, not used in IMPLAN Easements (ACEP, WRP, GRP, FRPP) Savings (Surplus), not used in IMPLAN Easements (ACEP, WRP, GRP, FRPP) Personal Tax: Income Tax, not used in IMPLAN Easements (ACEP, WRP, GRP, FRPP) Households k Spending Pattern, basic extra spending Easements (ACEP, WRP, GRP, FRPP) Construction of new commercial structures, including farm structures Easements (ACEP, WRP, GRP, FRPP) Farm machinery and equipment Easements (ACEP, WRP, GRP, FRPP) Support activities for agriculture and forestry, other farm expenditures.")
10
Add any needed adjustments Add Labor, Profits, and Easement Payments into Direct Labor Income and Value Added following example IMPLAN training videos of analysis of parts.

11
Standard IMPLAN Output Program FA Federal Cost Direct Missouri Impacts Total Output Total Value Added Direct Jobs Total Jobs Jobs per $1M of Federal Cost Federal Cost to Output Multiplier Ag Conservation Easement Program ACEP$3,047,243$1,153,425 $2,059,400$4,091,09914.120.6 6.76 0.68 Conservation Security CSPG$1,516,054 $0$1,286,157$2,246,8680.09.7 6.40 0.85 Conservation Stewardship CSTP$30,163,781 $9,663,391$34,594,900$41,669,368210.7395.8 13.12 1.15 EG08 $5,043 $9,556$4,3990.00.1 19.83 1.90 Environmental Quality Enhancement EQIP$21,383,506 $17,109,999$32,476,155 $19,340,804 248.5359.4 16.81 1.52 Wildlife Habitat Incentives Program WHIP$159,393 $142,004$259,248 $168,872 3.04.0 25.10 1.63 Wetland Reserve Program WRPG$1,839,549 $1,352,021$2,473,541 $2,003,775 11.419.9 10.82 1.34 Small Watershed Operations WSOP$632,410 $922,976 $686,297 8.911.0 17.39 1.46 Financial Assistance Totals $ 58,746,979 $ 30,058,293 $ 74,081,933 $ 70,211,482 497 821 13.97 1.26 Combined Technical Assistance ImpactsTA $ 33,884,067$20,159,102$36,599,596$21,034,222551.7665.6 19.64 1.08 Combined Reimburstable AssistanceRA $ 184,062$179,179$319,238$208,2143.84.8 26.08 1.73 Total Impacts $ 92,815,108 $ 50,217,395 $ 110,681,529 $ 91,245,704 1,048 1,486 16.01 1.19 Added 380 current NRCS Missouri Jobs to TA Direct Jobs and Total Jobs

12
Example NRCS IMPLAN Analyses http://www.nrcs.usda.gov/wps/portal/nrcs/detail/national/technical/econ/tools/?cid=nrcs143_009732 http://www.nrcs.usda.gov/wps/portal/nrcs/detail/national/technical/econ/tools/?cid=nrcs143_009732

13
Questions

Similar presentations


 2013 FY Summary 2014 FY programs Environmental Quality Incentives Program Livestock Pond Initiative.>")

 is to provide national leadership in the conservation of soil, water, and related natural.>")


