Download presentation
Presentation is loading. Please wait.

1
Research Methods

2
Why do we have to learn this stuff? Before we delve into how to do research, you should be aware of THREE HURDLES that tend to skew our logic… Because some people believe this…& they’re wrong -_-

3
Hindsight Bias The tendency to believe, after learning the outcome, that you knew it all along. Let’s face it. If she really knew then we would not have songs like… Trouble = Harry Styles Begin Again = Connor Kennedy The Last Time = Jake Gyllenhaal Dear John = John Mayer Speak Now & Mine = Cory Monteith Back to December = Taylor Lautner Forever & Always = Joe Jonas …Go ahead and be super judgmental I know this, but we are the same age & I love her <3

4
Overconfidence We tend to think we know more than we do. 82% of U.S. drivers consider themselves to be in the top 30% of their group in terms of safety. 81% of new business owners felt they had an excellent chance of their businesses succeeding. When asked about the success of their peers, the answer was only 39%. (Now that's overconfidence!!!)
.")
5
The Barnum Effect The tendency for people to accept very general or vague characterizations of themselves and believe they are accurate. Like a horoscope (I’m a Taurus) or palm reader.
 or palm reader..")
6
3 Types of Research Descriptive Correlational Experimental

7
Descriptive Research Any research that observes and records. Does not talk about relationships, it just describes. What is going on in this picture? We cannot say exactly, but we can describe what we see. Thus we have…..

8
Types of Descriptive Research The Case Study The Survey Naturalistic Observation Longitudinal Study Cross-Sectional Study

9
Case Studies A detailed picture of one or a few subjects. Tells us a great story…but is just descriptive research. Does not even give us correlation data. An interesting case study would be Honey Boo Boo and her family. Really interesting, but what does it tell us about families in general?

10
Survey Method: The Good Most common type of study in psychology. Measures correlation. Cheap and fast. But you need a good random sample.

11
Survey Method: The Bad Low response rate. People lie. Wording effects.

12
Surveys and Sampling Identify the population you want to study. The sample must be representative of the population you want to study. GET A RANDOM SAMPLE!

13
Random Sampling

14
Why do we sample? One reason is the False Consensus Effect: the tendency to overestimate the extent to which others share our beliefs and behaviors. Fundamentalists and political radicals often overestimate the number of people who share their values and beliefs, because of the false consensus effect.

15
Naturalistic Observation Watch subjects in their natural environment. Do not manipulate the environment. The good is that there is no Hawthorne effect (we’ll get to this in a moment). The bad is that we can never really show cause and effect.
. The bad is that we can never really show cause and effect..")
16
Longitudinal Study Studying the same group of people over the years and noting changes. The Good= see how people change over time. The Bad = expensive, time consuming, and participants may not be available for the whole study.

17
Cross Sectional Study Various age groups studied at the same time. The Good = less time consuming than a longitudinal study. The Bad = differences cannot necessarily be attributed to age or development.

18
Correlational Method Correlation expresses a relationship between two variables. Does NOTshow causation!

19
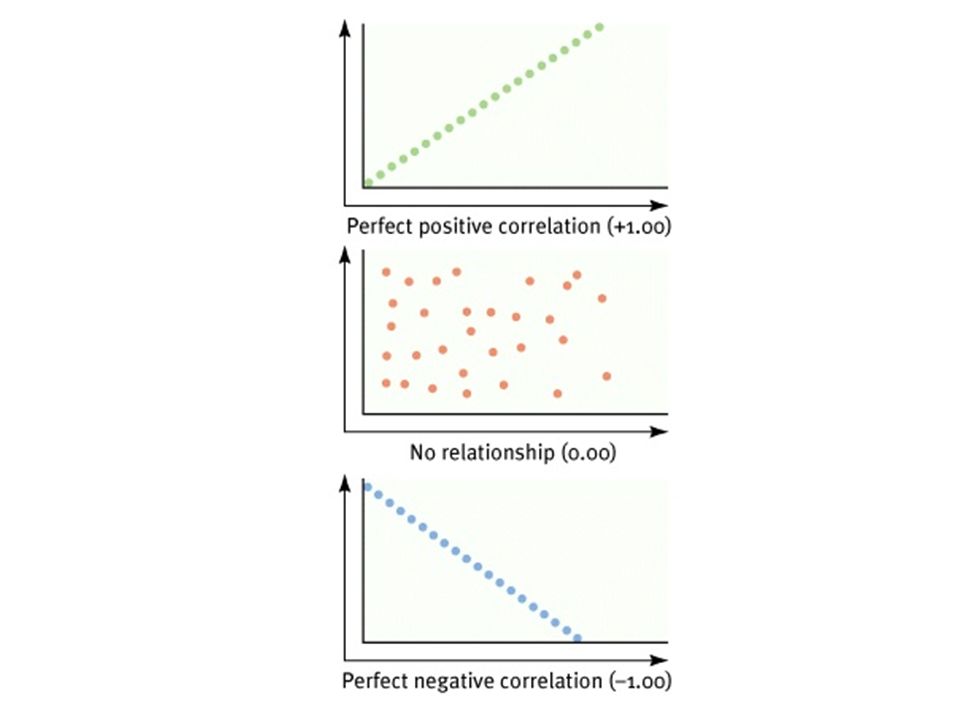
Types of Correlation Positive Correlation The variables go in the SAME direction. Negative Correlation The variables go in OPPOSITE directions. Studying and grades hopefully has a positive correlation. Heroin use and grades probably has a negative correlation.

21
Correlation Coefficient A number that measures the strength of a relationship. Range is from -1 to +1 The relationship gets weaker the closer you get to zero. Which is a stronger correlation? -.13 or +.38 -.72 or +.59 -.91 or +.04

22
How to Read a Correlation Coefficient

23
Experimental Method Looking to prove causal relationships. Cause and Effect. Laboratory vs. Field Experiments. https://www.youtube.com/watch?v=Z7P9 TKkAnhA https://www.youtube.com/watch?v=Z7P9 TKkAnhA

24
Steps in Designing an Experiment 1.Hypothesis. 2.Pick Population: Random Selection then Random Assignment. 3.Operationalize the Variables. 4.Identify Independent and Dependent Variables. 5.Look for Extraneous Variables. 6.Type of Experiment: Blind, Double Blind etc.. 7.Gather Data. 8.Analyze Results.

25
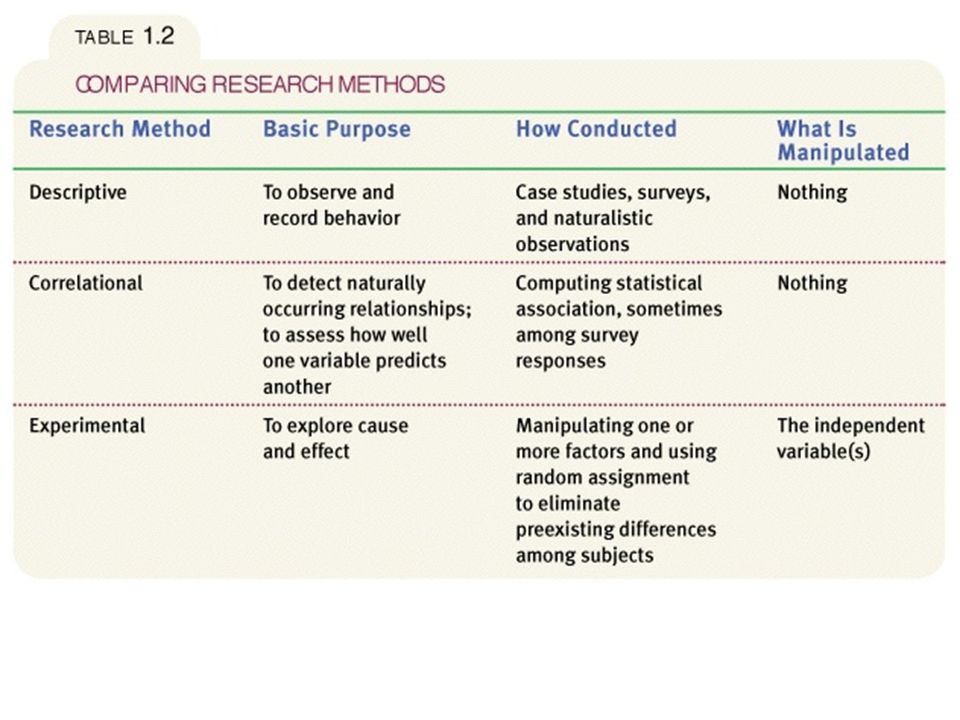
Terminology for Experiments

26
Hypothesis Expresses a relationship between two variables. A variable is anything that can vary among participants in a study. A useful hypothesis is a testable statement which may include a prediction. “Participating in class leads to better grades than not participating.”

27
Independent Variable Whatever is being manipulated in the experiment. Hopefully the independent variable brings about change. If there is a drug in an experiment, the drug is almost always the independent variable.

28
Dependent Variable The dependent variable would be the effect of the drug. Whatever is being measured in the experiment. It is dependent on the independent variable.

29
Operational Definitions Explain what you mean in your hypothesis. How will the variables be measured in “real life” terms. How you operationalize the variables will tell us if the study is valid and reliable. Let’s say your hypothesis is that chocolate causes violent behavior. What do you mean by chocolate? What do you mean by violent behavior?

30
Beware of Confounding Variables If I wanted to prove that smoking causes heart issues, what are some confounding variables? The object of an experiment is to prove that A causes B. A confounding variable is anything that could cause change in B, that is not A.

31
Random Assignment Once you have a random sample, randomly assign them into two groups (i.e. flipping a coin or random number generator). This helps control for confounding variables. Experimental Group (receives the independent variable) vs. Control Group (does not).
. This helps control for confounding variables. Experimental Group (receives the independent variable) vs. Control Group (does not)..")
32
Hawthorne Effect But even the control group may experience changes. Just the fact that you know you are in an experiment can cause change. Whether the lights were brighter or dimmer, production went up in the Hawthorne electric plant.

33
Experimenter Bias Another confounding variable. Not a conscious act. Double-Blind procedure helps eliminate this.

34
Other Confounding Variables Placebo effect - The beneficial effect in a subject following a particular treatment that arises from the subject’s expectations. Order effects - The effects of administering treatments or questions in a particular order.

36
Statistics Recording the results from our studies. Must use a common language so we all know what we are talking about.

37
Statistical Significance In an experiment, the results are called statistically significant if they are unlikely to have occurred by chance (no more than a 5% chance).
.")
38
Descriptive Statistics Just describes sets of data. You might create a frequency distribution. Frequency polygons or histograms.

39
Inferential Statistics The purpose is to discover whether the finding can be applied to the larger population from which the sample was collected.

40
Central Tendency Mean (the average), Median (middle score) and Mode (most frequent). Watch out for extreme scores or outliers; effects the mean the most!! $25,000-Pam $25,000- Kevin $25,000- Angela $100,000- Andy $100,000- Dwight $200,000- Jim $300,000- Michael Let’s look at the salaries of the employees at Dunder Mifflen Paper in Scranton: The median salary looks good at $100,000. The mean salary also looks good at about $110,000. But the mode salary is only $25,000. Maybe not the best place to work. Then again living in Scranton is kind of inexpensive.

41
Normal Distribution In a normal distribution, the mean, median and mode are all the same.

42
Distributions Outliers skew distributions. If a group has one high score, the curve has a positive skew (contains more low scores). If a group has a low outlier, the curve has a negative skew (contains more high scores).
. If a group has a low outlier, the curve has a negative skew (contains more high scores)..")
43
A Skewed Distribution Are the results positively or negatively skewed? Look at how much the mean is affected!

44
Other measures of variability Range: distance from highest to lowest scores. Standard Deviation: the variance of scores around the mean. The higher the variance or SD, the more spread out the distribution is. Do scientists want a big or small SD? A small one... less variance. Durant and LeBron may both score 30 ppg (same mean). But their SDs could be very different.
. But their SDs could be very different..")
45
Scores A indicates how many standard deviations an observation or datum is above or below the mean. A positive z score means a number above the mean. A negative z score means a number below the mean.

46
Normal Distribution

47
APA Ethical Guidelines for Research IRB - Internal Review Board. Both for humans and animals.

48
Animal Research Clear purpose. Treated in a humane way. Acquire animals legally. Least amount of suffering possible.

49
Human Research No coercion - must be voluntary. Informed consent. Anonymity. No significant risk. Must debrief.

Similar presentations

>")


