Download presentation
Presentation is loading. Please wait.

1
MORE OR LESS EQUAL? Maths slideshow A

2
MATHS 1 Measuring inequality

4
WHAT DOES INEQUALITY MEAN? We can think of inequality as the difference between the things some groups of people have compared with other groups of people. It is a bit like looking at how a big a slice of cake one person has compared with another.

5
INCOME AND WEALTH Income is the amount of money a country or person earns as a result of paid work or investments. Wealth is the total value of everything that a country or person owns after any debts have been taken away.

6
INEQUALITY BETWEEN COUNTRIES There is inequality between countries in the world. This means things are not shared fairly between countries. For example, some countries are wealthy while others are extremely poor.

7
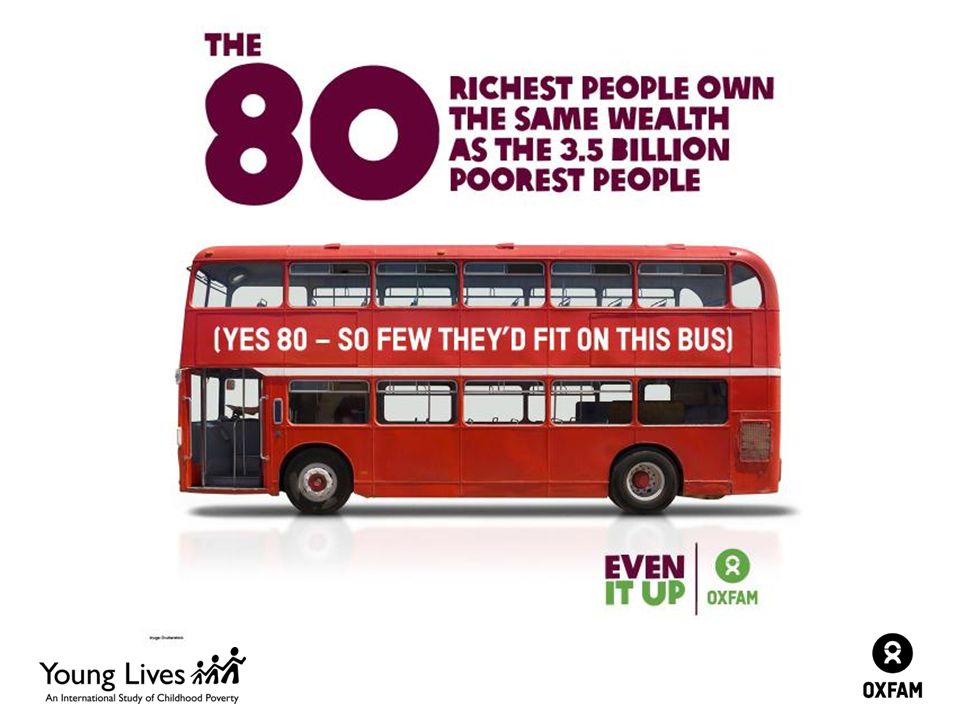
WEALTH INEQUALITY

8
WHAT IS YOUNG LIVES? Young Lives is an international research project looking at how poverty is affecting young people’s lives. It is led by a team in the Department of International Development at the University of Oxford in the UK. Researchers have followed the lives of 12,000 young people in four different countries – Ethiopia, India, Peru and Viet Nam – for 15 years, from 2000 to 2015.

9
WHERE IN THE WORLD? UK Peru Viet Nam Ethiopia India Can you locate the UK, Ethiopia, India, Peru and Viet Nam on a world map?

10
INEQUALITY WITHIN COUNTRIES There is also inequality within countries. This means things are not shared fairly within the same country. For example, some people may have more money than others.

11
WHAT IS INEQUALITY? £20 £87 £10 £1 Group B Group A

12
THINKING ABOUT INEQUALITY Inequality is not just about how money is shared between and within countries. There can also be inequality in the kinds of opportunities people have in life.

13
Phuoc Viet Nam

14
H’Mai Viet Nam

15
EXTREME INEQUALITY IS UNJUST

16
CALCULATING THE PALMA RATIO 1 10% 2 10% 3 10% 4 10% 5 10% 6 10% 7 10% 8 10% 9 10% 10 10% PoorestRichest

17
CALCULATING THE PALMA RATIO Combined income of richest 10% (tenth group) Combined income of poorest 40% (first to fourth groups)
 Combined income of poorest 40% (first to fourth groups)")
18
PUT THEM IN ORDER UK India Peru Viet Nam Ethiopia Most equal Least equal

19
PALMA PROBLEMS TABLE 1

20
PALMA PROBLEMS TABLE 2

21
INEQUALITY AROUND THE WORLD GINI INDEX

22
MATHS 2 Measuring development

23
WHAT IS YOUNG LIVES? The researchers have collected a lot of data about the young people’s lives. They have also interviewed the young people and some of their families. This is Elmer, one of the young people interviewed in the project. He is from Peru.

24
WHAT IS DEVELOPMENT? Development can be viewed as the process through which a place becomes better in some way. ‘Developed’ countries are often viewed as those that have better standards of living than ‘less developed’ countries.

25
Average income per person Access to water Life expectancy Infant mortality rate Access to electricity Primary school enrolment MEASURING DEVELOPMENT

26
Gender equality Number of doctors per 1,000 people CO 2 emissions Internet users Mobile phone subscriptions Percentage living in extreme poverty MEASURING DEVELOPMENT

27
TIME TO THINK Which indicator do you think is the best measure of development and why? What problems do you think there might be in using some of these development indicators? What do you think would be best, to use just one development indicator or a range of different ones? Why do you think this? What patterns and relationships do you think there might be between these different development indicators? How might you test your predictions?

28
DEVELOPMENT TRUMPS How do these development indicators vary between the different countries? Does any of the data surprise you? Which data and why? What between-country gaps do you notice? Which country do you think is the most ‘developed’ and why? Which country do you think is the least ‘developed’ and why? Which of the four Young Lives countries (Ethiopia, India, Peru and Viet Nam) do you think is the most ‘developed’/least ‘developed’? How does the UK compare with them?
 do you think is the most ‘developed’/least ‘developed’. How does the UK compare with them .")
29
LIFE EXPECTANCY AND GDP

30
MATHS 3 In-country gaps 1

31
WHAT ACTIVITIES DO YOU DO EACH DAY? SleepingAttending school Tasks for family farm or business Work for pay outside the household Domestic tasks Studying outside of school Play or leisure activities Caring for others

32
HADUSH’S DAY ETHIOPIA

33
Hadush Ethiopia

34
COMPARING SAMPLE SIZE

Similar presentations


 be like?>")


 GNP- Refers to the total value of all goods and services produced by a country.>")


