Download presentation
Presentation is loading. Please wait.

1
Noel-Levitz Student Satisfaction Survey University of Louisville Fall of 2002

2
About the Four-Year Public version: Measures two critical dimensions: importance and satisfaction – Students answered each question on a Likert scale to show level of importance & satisfaction Compares our students with those from other four-year public institutions Proven to be statistically reliable when compared to other similar surveys

3
Each Report Includes: Demographic Summary – 2002: 128 Institutions & 115,595 student records Scale Summary Graphs Institutional Summary Summary Items Target Group Reports Optional Comparison Reports

4
U of L Student Participation 1995 – 729 Surveys completed 1999 – 820 Surveys completed 2002 – 1658 Surveys completed

5
Fall 2002 U of L Participants 62% female 38% male 41% Freshmen 27% Sophomores 17% Juniors 14% Seniors 54% female 46% male 35% Freshmen 21% Sophomores 20% Juniors 25% Seniors Overall U of L Demographics (2000)
")
6
Fall 2002 U of L Participants 76% Caucasian 12% African-American 3% Asian/Pacific Islander 1% Hispanic 54% Arts & Sciences 20% Business 13% Speed 9% Education 8% Nursing 1% Music 81% Caucasian 13% African-American 3% Asian/Pacific Islander 1% Hispanic 55% Arts & Sciences 20% Business 10% Speed 5% Education 4% Nursing 2% Music Overall U of L Demographics (2000)
")
7
12 categories used by Noel-Levitz: (4 to 17 questions included in each category) Academic Advising Recruitment and Financial Aid Campus Life Campus Support Services Concern for the Individual Student Centeredness Instructional Effectiveness Campus Climate Registration Effectiveness Responsiveness to Diverse Populations Safety and Security Service Excellence
 Academic Advising Recruitment and Financial Aid Campus Life Campus Support Services Concern for the Individual Student Centeredness Instructional Effectiveness Campus Climate Registration Effectiveness Responsiveness to Diverse Populations Safety and Security Service Excellence")
12
(Includes: Institution's concern for individual academic success) *Difference between U of L 2002 results and overall 2002 results is statistically significant at the.001 level †Difference between 199 results and 2002 results is statistically significant at the.001 level * †
 *Difference between U of L 2002 results and overall 2002 results is statistically significant at the.001 level †Difference between 199 results and 2002 results is statistically significant at the.001 level * †")
13
(Includes: Institution's concern for individual academic success)
")
20
(Includes: Open communication channels, strong campus community, sense of belonging) *Difference between U of L 2002 results and overall 2002 results is statistically significant at the.01 level †Difference between 199 results and 2002 results is statistically significant at the.001 level * †
 *Difference between U of L 2002 results and overall 2002 results is statistically significant at the.01 level †Difference between 199 results and 2002 results is statistically significant at the.001 level * †")
21
(Includes: Open communication channels, strong campus community, sense of belonging)
")
24
(Includes: Social activities, organizations, residential life and athletic opportunities) *Difference between U of L 2002 results and overall 2002 results is statistically significant at the.001 level †Difference between 199 results and 2002 results is statistically significant at the.001 level * †
 *Difference between U of L 2002 results and overall 2002 results is statistically significant at the.001 level †Difference between 199 results and 2002 results is statistically significant at the.001 level * †")
25
(Includes: Social activities, organizations, residential life and athletic opportunities)
")
28
(Includes: Availability of staff, services and resources) *Difference between U of L 2002 results and overall 2002 results is statistically significant at the.001 level †Difference between 199 results and 2002 results is statistically significant at the.001 level * †
 *Difference between U of L 2002 results and overall 2002 results is statistically significant at the.001 level †Difference between 199 results and 2002 results is statistically significant at the.001 level * †")
29
(Includes: Availability of staff, services and resources)
")
31
(Includes: Exhibition of individual care, concern and fairness) *Difference between U of L 2002 results and overall 2002 results is statistically significant at the.001 level †Difference between 199 results and 2002 results is statistically significant at the.001 level * †
 *Difference between U of L 2002 results and overall 2002 results is statistically significant at the.001 level †Difference between 199 results and 2002 results is statistically significant at the.001 level * †")
32
(Includes: Exhibition of individual care, concern and fairness)
")
34
(Includes: Faculty commitment and accessibility and quality of instruction) *Difference between U of L 2002 results and overall 2002 results is statistically significant at the.001 level †Difference between 199 results and 2002 results is statistically significant at the.001 level * †
 *Difference between U of L 2002 results and overall 2002 results is statistically significant at the.001 level †Difference between 199 results and 2002 results is statistically significant at the.001 level * †")
35
(Includes: Faculty commitment and accessibility and quality of instruction)
")
39
(Includes: Quality of services provided by admission and financial aid offices) *Difference between U of L 2002 results and overall 2002 results is statistically significant at the.001 level †Difference between 199 results and 2002 results is statistically significant at the.001 level * †
 *Difference between U of L 2002 results and overall 2002 results is statistically significant at the.001 level †Difference between 199 results and 2002 results is statistically significant at the.001 level * †")
40
(Includes: Quality of services provided by admission and financial aid offices)
")
42
(Includes: Quality of services provided by registrar and bursar offices) *Difference between U of L 2002 results and overall 2002 results is statistically significant at the.001 level †Difference between 199 results and 2002 results is statistically significant at the.001 level * †
 *Difference between U of L 2002 results and overall 2002 results is statistically significant at the.001 level †Difference between 199 results and 2002 results is statistically significant at the.001 level * †")
43
(Includes: Quality of services provided by registrar and bursar offices)
")
45
(Includes: Institution’s commitment to various subcultures) No statistical significance in this category
 No statistical significance in this category")
46
(Includes: Institution’s commitment to various subcultures)
")
48
(Includes: Campus safety services and security responsiveness) †Difference between 199 results and 2002 results is statistically significant at the.01 level †
 †Difference between 199 results and 2002 results is statistically significant at the.01 level †")
49
(Includes: Student parking and student safety at night)
")
50
(Includes: Customer service to students) *Difference between U of L 2002 results and overall 2002 results is statistically significant at the.001 level †Difference between 199 results and 2002 results is statistically significant at the.001 level * †
 *Difference between U of L 2002 results and overall 2002 results is statistically significant at the.001 level †Difference between 199 results and 2002 results is statistically significant at the.001 level * †")
51
(Includes: Customer service to students)
")
52
(Includes: Concern and care shown toward students) †Difference between 199 results and 2002 results is statistically significant at the.001 level †
 †Difference between 199 results and 2002 results is statistically significant at the.001 level †")
53
(Includes: Concern and care shown toward students)
")
54
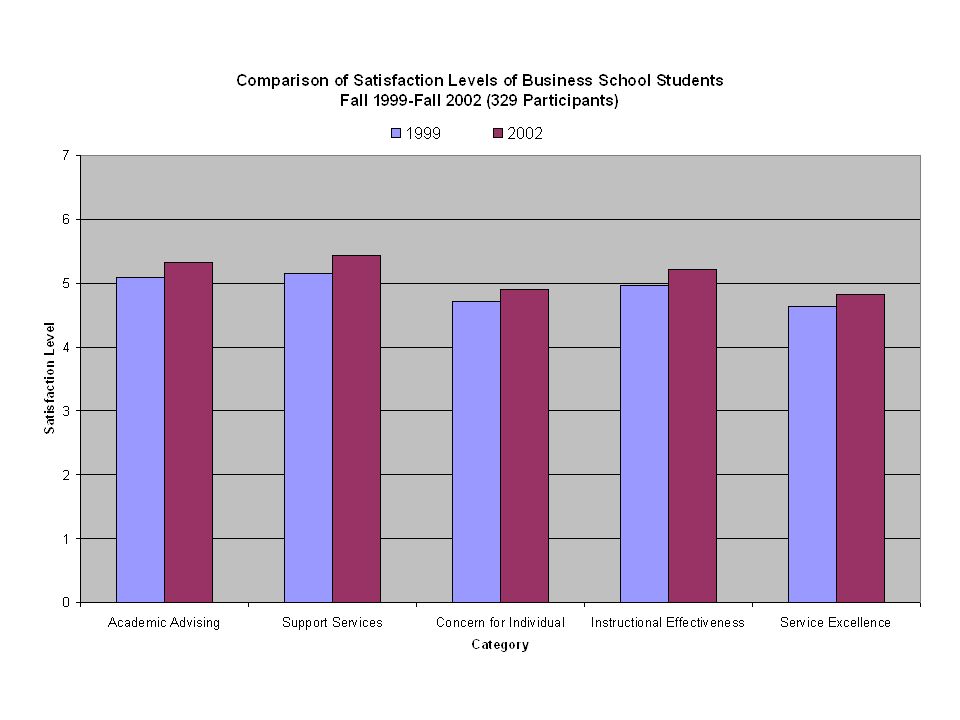
University of Louisville African-American Students Comparison of Satisfaction Levels 200 African-American Participants (12%)
")
57
(Includes: Institution’s concern for individual academic success)
")
59
(Includes: Open communication channels, strong campus community, sense of belonging)
")
63
(Includes: Social activities, organizations, residential life, athletic opportunities)
")
67
(Includes: Availability of staff, services and resources)
")
70
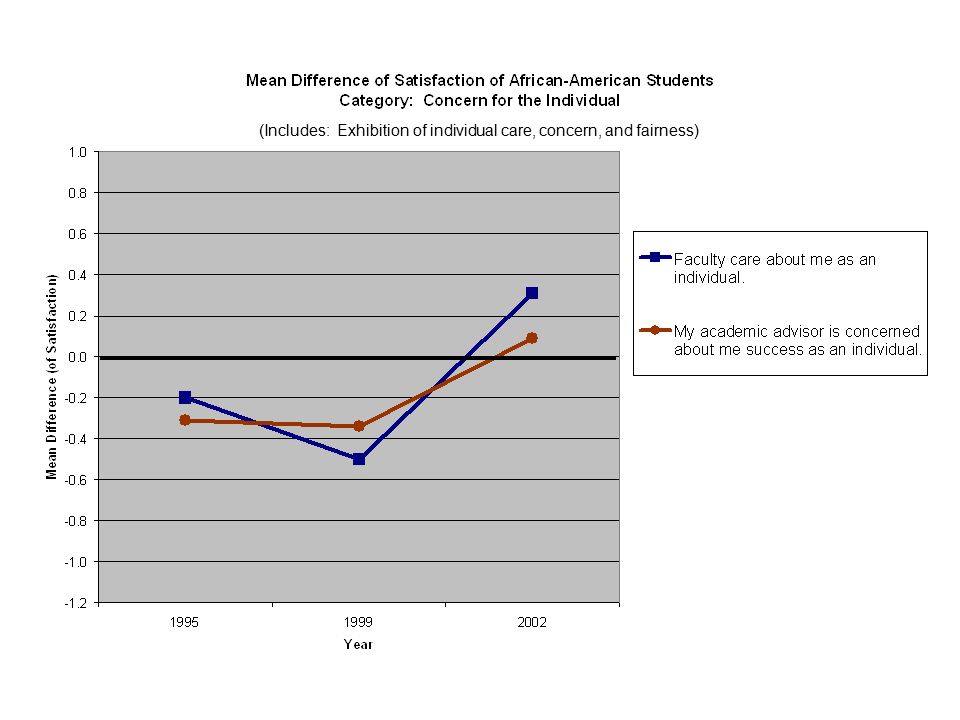
(Includes: Exhibition of individual care, concern, and fairness)
")
73
(Includes: Faculty commitment and accessibility, quality instruction)
")
78
(Includes: Quality of services provided by admission and financial aid offices)
")
81
(Includes: Quality of services provided by registrar and bursar offices)
")
84
(Includes: Institution’s commitment to various subcultures)
")
87
(Includes: Student parking and student safety at night)
")
89
(Includes: Customer service to students)
")
91
(Includes: Concern and care shown toward students)
")
93
Noel-Levitz Summary Student expectations continue to rise Compared to 128 Institutions: – Student satisfaction above the mean in eleven areas – Student satisfaction lowest in Student Centeredness Satisfaction in Advising at U of L increased African-Americans satisfaction increased overall

Similar presentations


 1997 to 2013.>")


>")

