Download presentation
Presentation is loading. Please wait.

1
Geology 5660/6660 Applied Geophysics 24 Feb 2016 © A.R. Lowry 2016 For Fri 26 Feb: Burger 524-539 (§8.4) Last Time: Industry Seismic Interpretation Well ties, where possible, are critical to both processing and interpretation (uses sonic log, VSP) Horizon attribute maps (dip, dip-azimuth, amplitude, relief, roughness etc) structure & sed features Coherence cubes bring out discontinuities (fault structures) (but can misinterpret coherent noise as continuous features) Coherent noise can arise from out-of-plane energy, uncorrected diffractions, time migration instead of depth in environments where velocity changes laterally Knowledge of geological processes and noise properties are both key to interpretation!!!!
 Last Time: Industry Seismic Interpretation Well ties, where possible, are critical to both processing and interpretation (uses sonic log, VSP) Horizon attribute maps (dip, dip-azimuth, amplitude, relief, roughness etc) structure & sed features Coherence cubes bring out discontinuities (fault structures) (but can misinterpret coherent noise as continuous features) Coherent noise can arise from out-of-plane energy, uncorrected diffractions, time migration instead of depth in environments where velocity changes laterally Knowledge of geological processes and noise properties are both key to interpretation!!!!.")
2
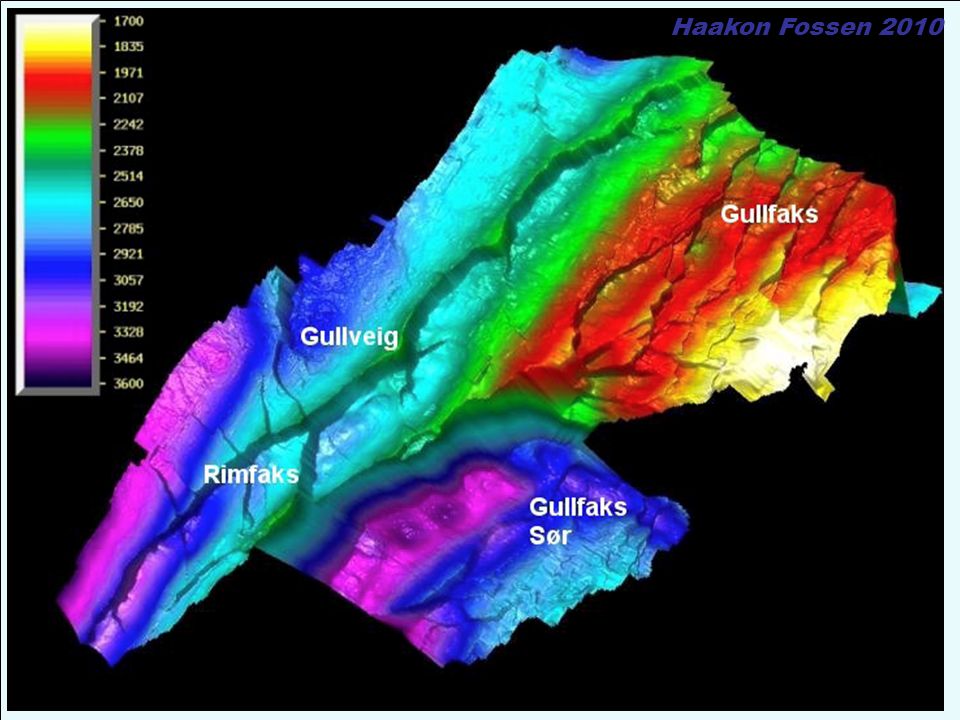
Haakon Fossen 2010 In industry, the process of determining what physical characteristics of rocks and pore fluid could have produced a given seismic image/data set Seismic inversion

3
Haakon Fossen 2010 Correlation

4
Haakon Fossen 2010

7
Good seismic interpretation + Good depth conversion model = Accurate structure maps Haakon Fossen 2010

8
TimeDepth Depth conversion Requires a velocity model, based on well information or stacking velocities (from the processing of the seismic data)
")
9
Haakon Fossen 2010 Some 3D seismic is depth migrated, which gives a more realistic image (geometrically) Not easy to manage in a field with new wells being drilled Depth migration
 Not easy to manage in a field with new wells being drilled Depth migration")
11
Haakon Fossen 2010 3-D visualization

12
Haakon Fossen 2010

13
3-D visualization A complete 3D picture of the subsurface near two producing oil fields in the Gulf of Mexico not only shows the sea bed at some 1,000m water depth, but features such as salt structures in green and a salt diapir that penetrates the sea bed (white). Thin lines show the paths of wells drilled to over 2000m below the sea bed to develop the fields, fanning out to penetrate various reservoirs. Shallow bodies in front of the well paths on the left hand side may provide hazards to drilling. Oil field reservoirs can be seen in colour (yellows and reds) at deeper levels. Most features are extracted from the actual data, though parts of two seismic profiles are shown in black and white near the base of the display.
 at deeper levels. Most features are extracted from the actual data, though parts of two seismic profiles are shown in black and white near the base of the display..")
14
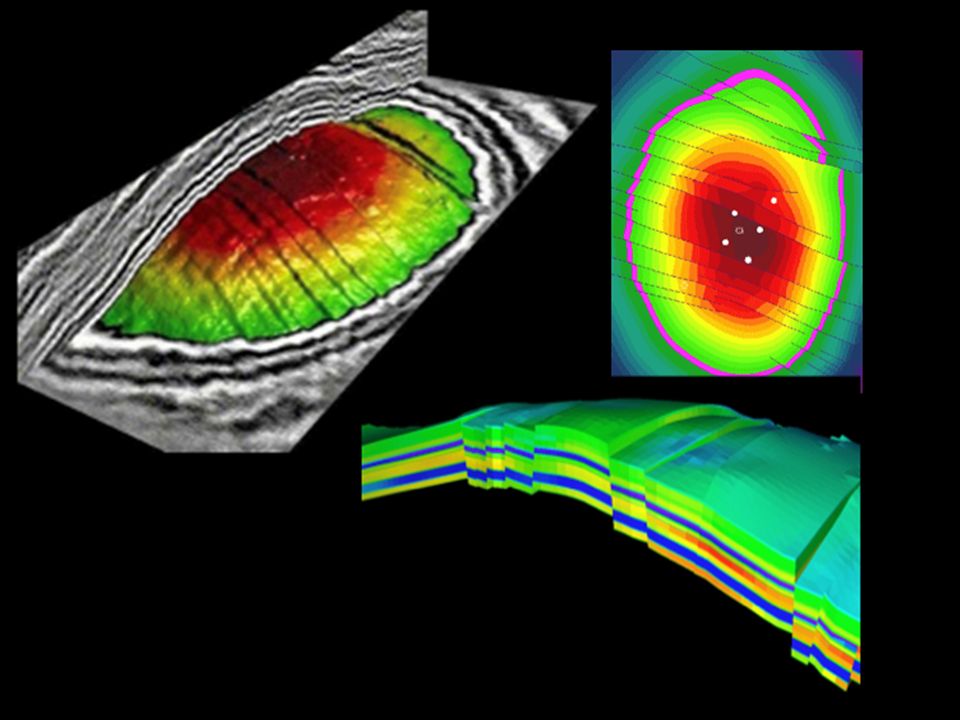
Haakon Fossen 2010 4D seismic data is the combination of several 3D datasets collected at different times and collected/processed in the same way The difference tells us where and how changes have occurred in the reservoir during production in the time interval. This information is used for optimal positioning of new wells 4-D seismic

15
Haakon Fossen 2010

17
Production Injection

18
Haakon Fossen 2010 Salt structures

19
Haakon Fossen 2010 Salt structures

20
Haakon Fossen 2010

22
Kombineres med seismiske data Electromagnetic imaging also growing in use…

23
Haakon Fossen 2010 … Here combined with seismic data

Similar presentations


 at the Frio Project T.M. Daley, L.R. Myer*, G.M. Hoversten and E.L. Majer.>")


