Download presentation
Presentation is loading. Please wait.

1
DIA Method Design, Data Acquisition, and Assessment
Jarrett Egertson, Ph.D.

2
Part One: Fundamental Method Design

3
There is No Universal DIA Method
Duty cycle Number of Injections m/z Range Covered Isolation Width Resolving Power AGC Target / Max Inject Time

4
Duty Cycle ~30 seconds ~30 seconds Duty Cycle: 4 seconds
10 Hz m/z-wide windows = 400 m/z 500 m/z 900 m/z-wide windows = 400 m/z m/z 500 900 ~7 scans 15 scans ~30 seconds ~30 seconds Duty Cycle: 4 seconds Duty Cycle: 2 seconds

5
Duty Cycle ~6 seconds 10 Hz 20 20 m/z-wide windows = 400 m/z m/z 500
900 m/z-wide windows = 400 m/z m/z 500 900 ~6 seconds

6
Number of Injections ~30 seconds ~30 seconds
80 5 m/z-wide windows = 400 m/z m/z 500 900 40 5 m/z-wide windows = 200 m/z 40 5 m/z-wide windows = 200 m/z 500 m/z 900 ~30 seconds ~30 seconds

7
m/z Range Covered

8
Isolation Window Width
DDA DIA Vs. Vs. 2 m/z 10 m/z 20 m/z Lower precursor selectivity More peptides co-fragmented More complex MS/MS spectra More interference

9
Precursor Selectivity
2 m/z ANFQGAITNR

10
Precursor Selectivity
10 m/z ANFQGAITNR

11
Precursor Selectivity
20 m/z ANFQGAITNR

12
Precursor Selectivity
Intensity 10 m/z ANFQGAITNR 25 Retention Time (min) 26
 26.")
13
Precursor Selectivity
X Intensity 4e7 10 m/z ANFQGAITNR Retention Time (min) Intensity 4e7 25 26 20 m/z X
 Intensity. 4e m/z. X. ")
14
Precursor Selectivity
890 X 900 SLQDIIAILGMDELSEEDKLTVSR+++ (897.8 m/z) SLQDIIAILGMDELSEEDKLTVSR+++ ( m/z) X
 SLQDIIAILGMDELSEEDKLTVSR+++ ( m/z) X.")
15
Precursor Selectivity

16
Resolving Power

17
Precursor Selectivity
890 X 900 SLQDIIAILGMDELSEEDKLTVSR+++ (897.8 m/z) SLQDIIAILGMDELSEEDKLTVSR+++ ( m/z) X
 SLQDIIAILGMDELSEEDKLTVSR+++ ( m/z) X.")
18
Precursor and Fragment Ion Selectivity
Gallien S, Duriez E., Demeure K, Domon B JPR 2013

19
4 m/z is Key Number for Isolation
Valine Isoleucine + CH2 +2: m/z +3: m/z

20
Even Better Precursor Selectivity is Useful when using Isotope-Labeled Standards
Light Precursor Heavy Precursor FDSPESHVGVAWR FDSPE SHVGVAWR FDSPES HVGVAWR FDSPESH VGVAWR FDSPESHVGVAWR[+10] FDSPE SHVGVAWR[+10] FDSPES HVGVAWR[+10] FDSPESH VGVAWR[+10] Light b - ions Light y - ions Light b - ions Heavy y - ions

21
Transition Selection for DIA – y-ions only!
FDSPESHVGVAWR[+10]++ m/z FDSPESHVGVAWR++ m/z 5 m/z

22
Transition Selection for DIA – y-ions only!
FDSPESHVGVAWR[+10]++ m/z FDSPESHVGVAWR++ m/z 5 m/z SRM Isolation 0.7 m/z, centered OK b or y

23
Transition Selection for DIA – y-ions only!
FDSPESHVGVAWR[+10]++ m/z FDSPESHVGVAWR++ m/z 5 m/z DIA Isolation 20 m/z BAD only y

24
Transition Selection for DIA – y-ions only!
FDSPESHVGVAWR[+10]++ m/z FDSPESHVGVAWR++ m/z 5 m/z DIA Isolation 20 m/z OK b or y

25
Transition Selection for DIA – y-ions only!
FDSPESHVGVAWR[+10]++ m/z FDSPESHVGVAWR++ m/z 5 m/z DIA Isolation 20 m/z Still Bad – y only

26
AGC Target / Max IT DDA DIA MS/MS for peptide identification
For detection – only enough ions to generate peptide-spectrum match Long fill times may mean slower acquisition rate, less ID’s MS/MS for peptide detection and quantification For quantification – want as many ions as possible Precision Sensitivity Intra-scan dynamic range Long fill times can slow down duty cycle, hinder quantification

27
DIA Parameters Influence Each Other
Duty cycle Number of Injections m/z Range Covered Isolation Width Resolving Power AGC Target / Max Inject Time Duty cycle Number of Injections m/z Range Covered Isolation Width Resolving Power AGC Target / Max Inject Time

28
Putting Together a DIA Method
Duty cycle Number of Injections (1) m/z Range Covered Isolation Width Resolving Power AGC Target / Max IT Determine Duty Cycle Choose Isolation Window Width Determine max IT/ Resolving Power Determine m/z Range To Cover
 m/z Range Covered Isolation Width Resolving Power AGC Target / Max IT Determine Duty Cycle. Choose Isolation Window Width. Determine max IT/ Resolving Power. Determine m/z Range To Cover. ")
29
Step 1: Determine Duty Cycle
Required duty cycle based on LC At least 7 points across chromatographic peak Narrow peaks Faster duty cycle ~15 seconds 15 seconds / 7 points = 2.15 second duty cycle Determine Duty Cycle

30
Step 2: Determine m/z Range to Cover
PRTC Peptides

31
Step 3: Choose Isolation Window Width
For 500 – 900 m/z on QE: m/z QE-HF: 10 – 20 m/z Fusion: 10 – 20 m/z More important for complex samples Selectivity Ion Counts

32
Determine Required Acquisition Rate
Duty Cycle 2.0 seconds m/z Range 500 – 900 m/z (400 m/z) Isolation Width 20 m/z (900 𝑚/𝑧 −500 𝑚/𝑧) 20 𝑚/𝑧 = 20 scans MS/MS Scans per Duty Cycle: MS Scans per Duty Cycle: 1 (assume ~75 ms for acquisition) Required MS/MS Acquisition Rate (2000 𝑚𝑠 −75 𝑚𝑠) 20 𝑠𝑐𝑎𝑛𝑠 = ms / scan = 10.4 Hz
 Isolation Width. 20 m/z. (900 𝑚/𝑧 −500 𝑚/𝑧) 20 𝑚/𝑧 = 20 scans. MS/MS Scans per Duty Cycle: MS Scans per Duty Cycle: 1 (assume ~75 ms for acquisition) Required MS/MS Acquisition Rate. (2000 𝑚𝑠 −75 𝑚𝑠) 20 𝑠𝑐𝑎𝑛𝑠 = ms / scan = 10.4 Hz.")
33
Determine IT / Resolving Power (QE-HF)
AGC Target: 1e6

34
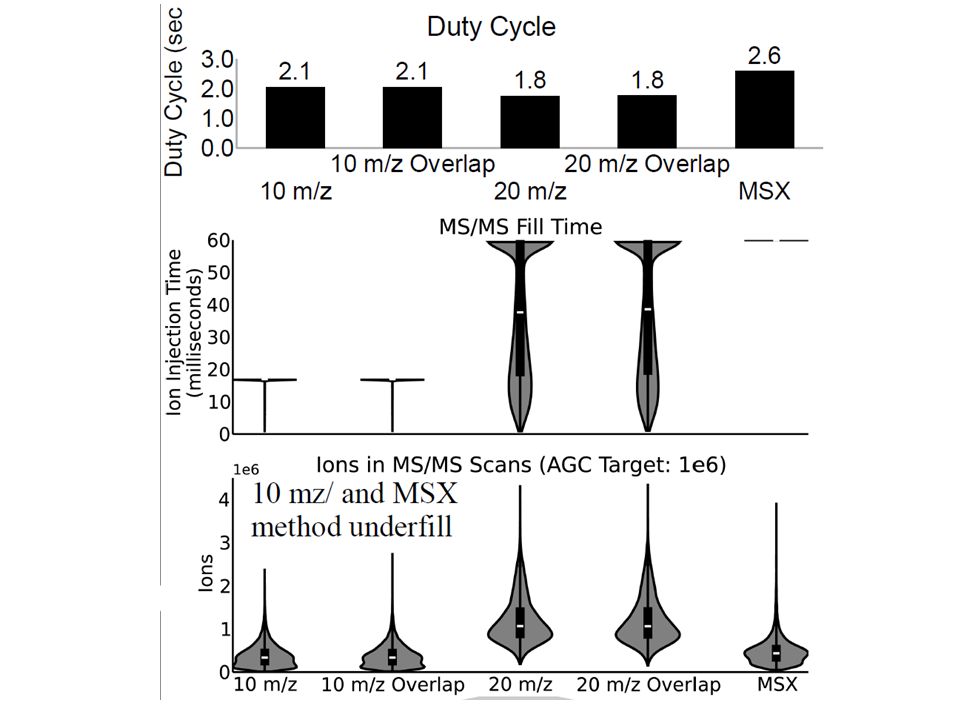
40 x 10 m/z Method Underfills (QE-HF)
Selectivity Ion Counts Selectivity Ion Counts Max IT: 17 milliseconds Max IT: 60 milliseconds

35
A Recommended Starting Point

36
A Recommended Starting Point
QE-HF (Increased MS2 Resolving Power) MS2 Resolving Power: 17,500 -> 30,000 Maximum IT: auto (49 ms) -> 60 ms Fusion Similar to QE-HF* Orbitrap acquisition is slightly slower AGC Target: 2e5
 MS2 Resolving Power: 17,500 -> 30,000. Maximum IT: auto (49 ms) -> 60 ms. Fusion. Similar to QE-HF* Orbitrap acquisition is slightly slower. AGC Target: 2e5.")
37
Part Two: Advanced Concepts

38
Advanced Concepts Optimizing isolation window placement
Isolation uniformity Resonance CID vs. HCD

39
Windows are no longer centered on precursors
Window Placement Windows are no longer centered on precursors 699.88 100 95 90 85 80 75 70 700.38 65 60 55 Relative Abundance 50 45 40 35 30 700.89 25 20 15 10 696.82 699.34 701.39 5 697.32 698.84 701.89 696.34 702.86 703.41 703.91 704.82 696 697 698 699 700 701 702 703 704 705 m/z

40
Peptides Masses Fall in Discrete Bins
m/z Mass Excess H C 12 0.0 O 0.9949 N 0.0031 S 0.9721

41
Window Placement H C N O Mass Excess H 1.00078 0.00078 C 12 0.0 O
0.9949 N 0.0031 S 0.9721 H C N O

42
Window Placement 26.0031 15.0023 Mass Excess H 1.00078 0.00078 C 12
0.9949 N 0.0031 S 0.9721

43
Peptides Masses Fall in Discrete Bins
m/z Mass Excess H C 12 0.0 O 0.9949 N 0.0031 S 0.9721

44
Window Placement

45
Window Placement

46
Skyline Demonstration
Generating a DIA Isolation List and Using it to Build a QE Method

47
Isolation Uniformity Q-Exactive Q-Exactive HF

48
Fragmentation Without a targeted precursor
CE may not be optimal (charge is unknown)
")
49
Fragmentation Without a targeted precursor
CE may not be optimal (charge is unknown)
")
50
Fragmentation Without a targeted precursor
CE may not be optimal (charge is unknown)
")
51
Fragmentation Without a targeted precursor
CE may not be optimal (charge is unknown)
")
52
Fragmentation Without a targeted precursor
CE may not be optimal (charge is unknown)
")
53
12 seconds total @ 17 Hz scan rate
Comparing reCID to HCD m/z 400 1000 m/z-wide windows = 600 m/z 12 seconds 17 Hz scan rate HCD Speed Preservation of fragment ions within isolated m/z range reCID: Efficient fragmentation without charge optimization Generation of b-ion series

54
Duty Cycle: reCID: ~16.7 Hz

55
Duty Cycle: HCD: ~20 Hz

56
Collision Energy Resonance CID May Outperform HCD for a DIA Experiment
C. elegans lysate, database search using SEQUEST

57
Part 3: Data Assessment

58
Quality Control Overview
QC QC QC QC Sample Sample Sample Sample Sample QC Sample # Peptide Sequence Mass Hydrophobicity Factor (HF) 1 SSAAPPPPPR 7.56 2 GISNEGQNASIK 15.50 3 HVLTSIGEK 15.52 4 DIPVPKPK 17.65 5 IGDYAGIK 19.15 6 TASEFDSAIAQDK 25.88 7 SAAGAFGPELSR 25.24 8 ELGQSGVDTYLQTK 28.37 9 GLILVGGYGTR 32.18 10 GILFVGSGVSGGEEGAR 34.50 11 SFANQPLEVVYSK 34.96 12 LTILEELR 37.30 13 NGFILDGFPR 40.42 14 ELASGLSFPVGFK 41.18 15 LSSEAPALFQFDLK 46.66 PRM Peptide Retention Time Calibration Mixture
 1. SSAAPPPPPR GISNEGQNASIK HVLTSIGEK DIPVPKPK IGDYAGIK TASEFDSAIAQDK SAAGAFGPELSR ELGQSGVDTYLQTK GLILVGGYGTR GILFVGSGVSGGEEGAR SFANQPLEVVYSK LTILEELR NGFILDGFPR ELASGLSFPVGFK LSSEAPALFQFDLK PRM. Peptide Retention Time Calibration Mixture.")
59
Skyline QC Demonstration
Generating a QC Method and Analyzing the Data in Skyline

60
Quality Control Targeted-MS2 allows for monitoring of chromatography
Retention time reproducibility is important for DIA (aids peak picking)
")
62
Conclusions There is no universal DIA method
Try to fill the trap for MS/MS scans Quality control should monitor chromatography Determine Duty Cycle Choose Isolation Window Width Determine max IT/ Resolving Power Determine m/z Range To Cover

Similar presentations


 Course Director David Fenyö Contact information>")
 Course Director David Fenyö Contact information>")


