Download presentation
Presentation is loading. Please wait.

1
The Massachusetts Economic Challenge Barry Bluestone Center for Urban and Regional Policy Northeastern University Massachusetts Building Trades Council 87 th Annual Convention March 16, 2006

2
Understanding the Massachusetts Economy Employment Household Income Demographic Trends Cost of Living Housing Trends

3
How is Massachusetts doing … economically? By the September 2005, employment in Massachusetts was still down by more than 160,000 from its pre-recession peak Real median household income dropped by 3.5% between 2000 and 2004

4
Employment Trend

6
U.S. vs. Massachusetts

7
Employment Growth Our employment growth for the last decade (1994-2004) is a dismal 65% of the national average and is lower than 8 of our competitor states, in some cases (AZ) less than a third of their growth.
 is a dismal 65% of the national average and is lower than 8 of our competitor states, in some cases (AZ) less than a third of their growth.")
8
Average Annual Percent Change in Employment 1994-2004 StatePercentage US1.41 Arizona3.45 Florida2.61 New Hampshire1.83 California1.80 Washington1.59 North Carolina1.32 New Jersey1.20 Rhode Island1.18 Massachusetts0.92 Pennsylvania0.83 New York0.76 Connecticut0.68 Michigan0.58 Source: Bureau of Labor Statistics

9
Greater Boston MSA Real Median Household Income 1969-1999 ($2004)
")
10
Greater Boston Real Median Household Income ($2004) 20002001200220032004
")
11
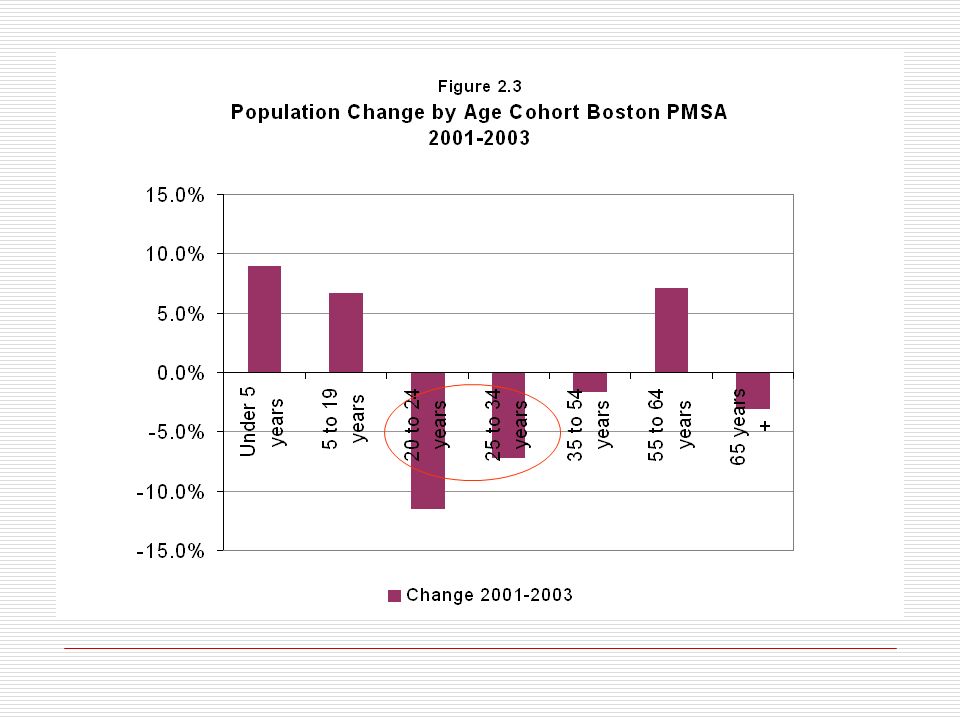
How do the demographics look? We are losing population to out- migration The largest net losses in population were in the young prime age cohorts

12
Greater Boston Population 2000-2004 20002001200220032004

13
Massachusetts Net Migration 2000-2004 2000-01 2001-02 2002-03 2003-04

15
Net Migration Between Massachusetts and Competitor States 1990-2002 State Net Migration From/to Massachusetts Massachusetts -213,000 Florida -99,082 New Hampshire -78,201 California -23,978 Arizona -11,033 North Carolina -8,983 Washington -4,516 Michigan 809 Pennsylvania 2,433 Rhode Island 2,895 New Jersey 9,672 Connecticut 14,997 New York 28,670 Source: Mass Inc, IRS

16
Where did they go?

17
What’s doing with the Cost of Living? According to a new measure of living costs, Greater Boston has the highest cost of living of any metro area in the United States A family of four needs $64,656 to pay for the costs of housing, transportation, day care, health care, and other basic necessities. This is more than $3,000 higher than in Washington, D.C; $6,000 higher than in New York City; and $7,000 more than in San Francisco Monthly housing costs are 40% higher than in Austin, Chicago, and Miami and 63% higher than in Raleigh- Durham-Chapel Hill

19
If you thought it was just Boston, you’re wrong! Source: Economic Policy Institute

20
A Tale of Two Cities Basic Budget 2 Parents, 2 Children Boston Monthly Housing$1,266 Monthly Food$ 587 Monthly Child Care$1,298 Monthly Transportation$ 321 Monthly Health Care$ 592 Monthly Other Necessity$ 500 Monthly Taxes$ 824 Monthly Total$5,388 Annual Total $64,656 Raleigh-Durham-Chapel Hill Monthly Housing$ 779 Monthly Food$ 587 Monthly Child Care$ 866 Monthly Transportation$ 358 Monthly Health Care$ 368 Monthly Other Necessity$ 369 Monthly Taxes$ 350 Monthly Total$3,677 Annual Total $ 44,124

21
Median Single Family Home Price 1987-2004

22
2005 Class A Apartment Rents Source: Forbes Magazine

23
199820002001200220032004 Below $100,000400000 $100,000 - $199,999 824114500 $200,000 - $299,999 506874624319 $300,000 - $399,999163242526174 $400,000 - $499,99941012223033 $500,000 - $999,9994918192533 $1,000,000 and Above000011 # of Communities with Median Single Family Sales Price

24
199820002001200220032004 Below $300,000 85.0%68.1%55.0%41.9%26.9%11.9% $300,000 - $499,999 12.5%26.3%33.8%46.3%56.9%66.9% $500,000 and Above 2.5%5.6%11.3%11.9%16.3%21.3% % of Communities with Median Single Family Sales Price

27
Economic Development: What we know Firms choose to locate is cities and towns, not states Investment and job creation occur at the local level Local municipalities in Massachusetts attract businesses Recent research with leading industrial and office developers and real estate specialists (NAIOP and CoreNet) confirms the importance of the local community environment to economic development
 confirms the importance of the local community environment to economic development")
28
What we know Key factors for businesses in making location decisions are: Availability of appropriate local labor pool Local crime rate Quality and capacity of local infrastructure Quality of local schools Physical attractiveness of the local area Timeliness of approvals at the municipal level Reputation of the community as a good place to live, work and invest

29
What we know Key Infrastructure: New School Construction Water and Sewer Local Roads and Highways State Highways and Bridges Mass Transit Expansion Airport Expansion Universal Wired & Wireless Internet

30
Conclusion – The Challenges Our high cost of living and inability to attract investment will lead to economic weakness, slow job growth, and demographic flight We must find a way to reduce housing costs and health costs We must find a way to attract firms, young people, and jobs by making our cities and towns the most attractive in the nation … with good schools, excellent roads, great parks, and other amenities.

Similar presentations