Download presentation
Presentation is loading. Please wait.

1
SAMPLING DISTRIBUTIONS Section 7.1, cont. GET A CALCULATOR!

2
p. 428 Population Distribution: gives the values of the variable for all individuals in the population.

3
p. 428 Distribution of the sample data: shows the values of the variable for the individuals in the sample.

4
p. 428 The sampling distribution of a statistic is the distribution of values taken by the statistic in all possible samples of the same size from the same population.

5
p. 428

6
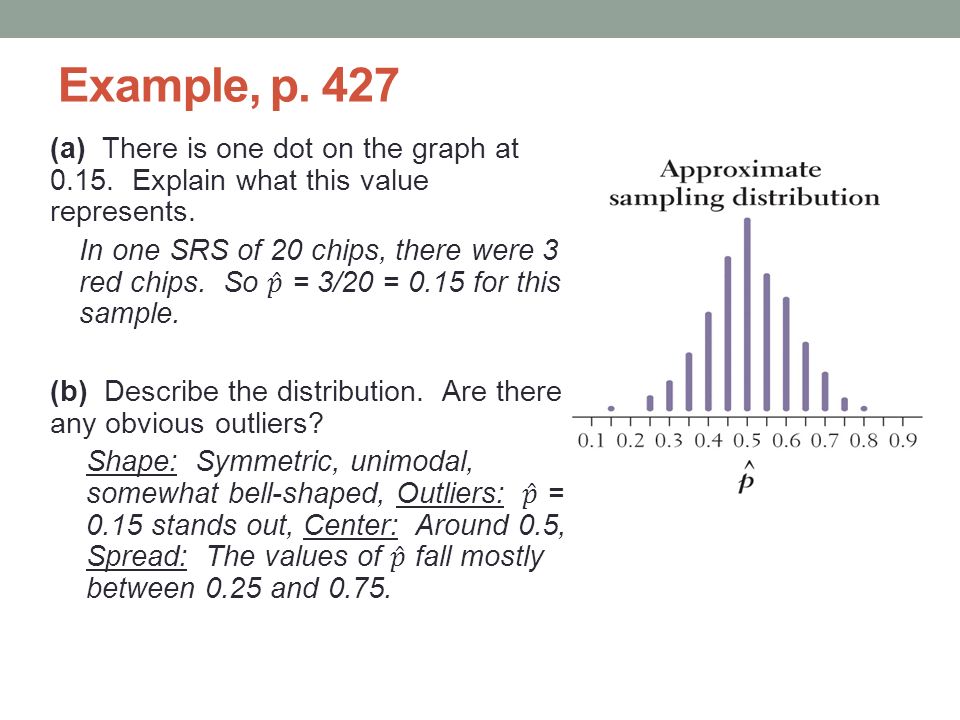
Example, p. 427

9
(d) Suppose your teacher prepares a bag with 200 chips and claims that half of them are red. A classmate takes an SRS of 20 chips; 17 of them are red. What would you conclude about your teacher’s claim? Explain. This student’s result gives strong evidence against the teacher’s claim. As noted in part (c), it is very unlikely to get a sample proportion of 0.85 or higher when p = 0.5.
, it is very unlikely to get a sample proportion of 0.85 or higher when p =")
10
Exam Tip **VERY IMPORTANT: Don’t say sample distribution when you mean sampling distribution. You will lose credit.

11
Describing Sampling Distributions New way to look at bias concerning center of a sampling distribution A statistic is unbiased if: The mean of its sampling distribution is equal to the true value of the parameter being estimated. Ex. The sample proportion of an SRS is an unbiased estimator of the population proportion p.

12
Describing Sampling Distributions Any size sample will yield unbiased statistics, but there is “less variability” (smaller spread) in larger samples Use the spread of the sampling distribution to describe variability
 in larger samples Use the spread of the sampling distribution to describe variability")
13
Spread of a Sampling Distribution The spread of a sampling distribution does not depend on population size; it depends on the sample size. Example: SamplesPopulation 1000 from 90,000 1000 from 280,000,000 Samples Population 100 from 90,000 1000 from 90,000 Will get the same distribution. Will get different spreads.

14
Why Sample Size Matters

15
Variability of a Statistic Described by the spread of its sampling distribution. The spread is determined mainly by the size of the random sample. Larger samples give smaller spreads. The spread of the sampling distribution does not depend much on the size of the population, as long as the population is at least 10 times larger than the sample.

16
Bias, Variability, and Shape, p. 434

17
HW p. 436 Due: Monday # 1, 3 – 6, 9, 11, 17, 19, 21, 23

Similar presentations

 is 2.5470 and the sample standard.>")


 “Sampling Distribution of Sample Means” > When we take repeated samples and calculate from each one,>")


 asks detailed.>")
 C18: Sampling Distributions.>")


