Download presentation
Presentation is loading. Please wait.

1
Watershed Restoration: Aquatic Resource Conservation at a Watershed Scale Todd Petty Professor of Aquatic Sciences February 4, 2013

2
Jennifer Fulton (EPA) Christine Mazzarella (EPA) Dennis Stottlemeyer (WVDEP) Eric Merriam (WVU) Eric Miller (WVU) Donna Hartman (WVU) OSM WVDEP USEPA Acknowledgements
 Christine Mazzarella (EPA) Dennis Stottlemeyer (WVDEP) Eric Merriam (WVU) Eric Miller (WVU) Donna Hartman (WVU) OSM WVDEP USEPA Acknowledgements")
3
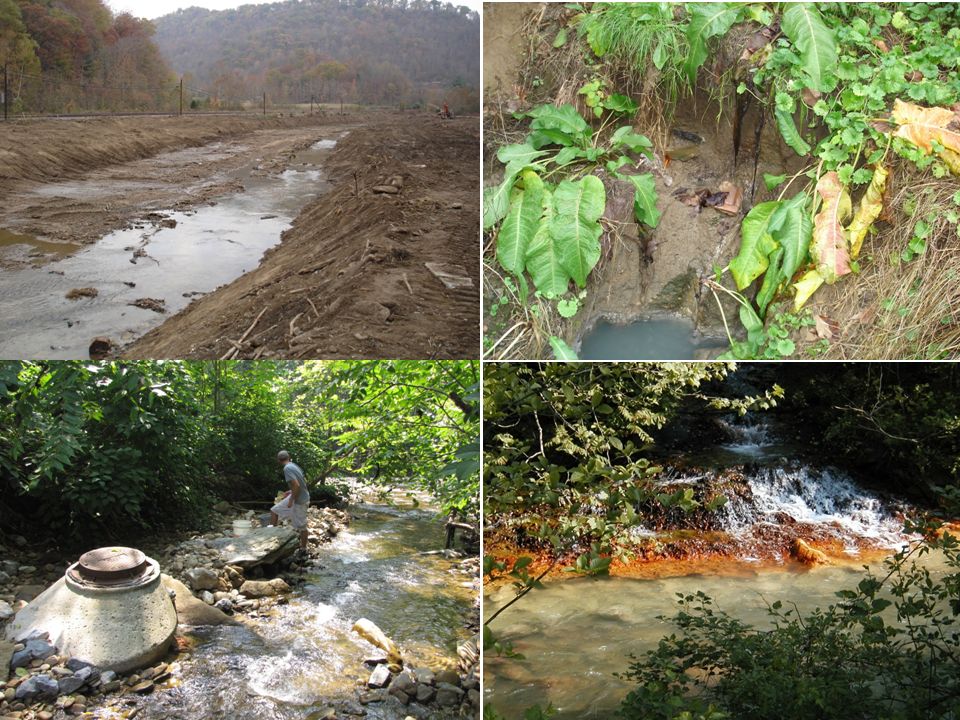
The MTM Debate MTR-VF mine in southern WV

4
Mining Intensive Ag Urbanization Highway Construction

6
Improve our understanding of multi-stressor interactions and effects on aquatic resources. Improve our ability to predict impacts of new development. Improve our ability to predict benefits of restoration. Build information into spatially-explicit watershed models that can be used to make decisions at multiple scales. Research Objectives

7
8 digit 12 digit 10 digit Segment Scale Site Scale Spatial Scale

8
LANDSCAPE Geology Soils Land Cover Fragmentation Mining Mine Distribution Development STREAM Habitat Flow Temperature Water Chemistry Drainage Area Isolation Inverts Fishes REFERENCE CONDITION Current Condition CONDITION FOLLOWING IMPACT CONDITION FOLLOWING REMEDIATION RESTORATION POTENTIAL VULNERABILITY DEGREE OF IMPAIRMENT Alternative Future Conditions Time NOWFUTURE Alt Futures

9
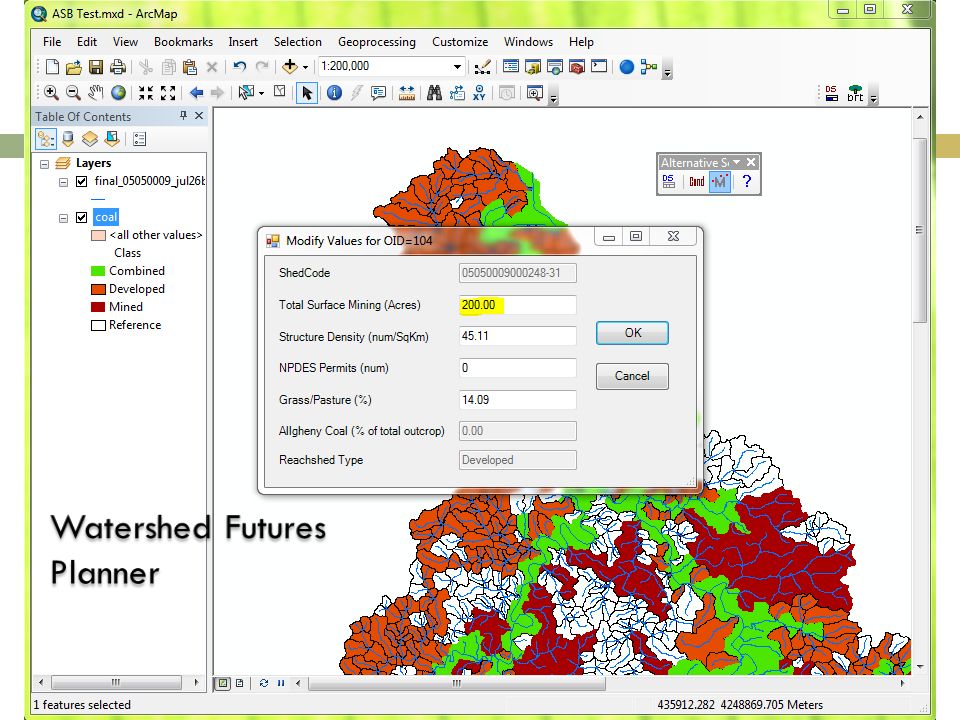
Watershed Futures Planner © GIS based analytical tool used to predict future condition of aquatic resources in a watershed under a series of alternative development / restoration scenarios.

10
Statistical Modeling Restoration Benefit Modeling Stress-Response Modeling Current Conditions Model Water Quality/Quantity Data Physico-chemical Attributes Biological Attributes Landscape Attributes Ecoregion Elevation Development Mining Water Use TSS pH Metals Flow HQI Presence - Absence Abundance Species Richness Composition Metrics IBI Socio-Economic Attributes Decision Support Analysis GIS Based Decision Support Tool Visualization Prioritization Futuring Apply User perceptions Median Income Human Health Watershed Orgs Local economies Watershed Futures Planner ©

11
Petty, Strager, and Ziemkiewicz Petty, J. T., J. B. Fulton, M. Strager, G. T. Merovich, J. Stiles, and P. Ziemkiewicz. 2010. Landscape indicators and thresholds of stream ecological impairment in an intensively mined Appalachian watershed. Journal of the North American Benthological Society 29:1292-1309. Merriam, E., J. T. Petty, G. T. Merovich, Jr., J. B. Fulton, and M. P. Strager. 2011. Additive effects of mining and development in a central Appalachian watershed. Journal of the North American Benthological Society 30:399-418. Strager, M. P., J. J. Fletcher, J. M. Strager, C. B. Yuill, R. N. Eli, J. T. Petty, and S. J. Lamont. 2010. Watershed analysis in GIS: the Watershed Characterization and Modeling System Software application. Computers and Geosciences 36:970-976. Strager, M. P., J. T. Petty, J. M. Strager, and J. B. Fulton. 2009. A spatially explicit framework for quantifying downstream hydrologic conditions. Journal of Environmental Management 90:1854-1863. Petty, J. T., and D. Thorne. 2005. An ecologically based approach for identifying restoration priorities in acid impacted watersheds. Restoration Ecology. 13:348-357.

12
2010 – 2011 2012 Approximately 260 study sites MTR-VF Region

14
Local vs. cumulative conditions Derived from 2009 NAIP photography

15
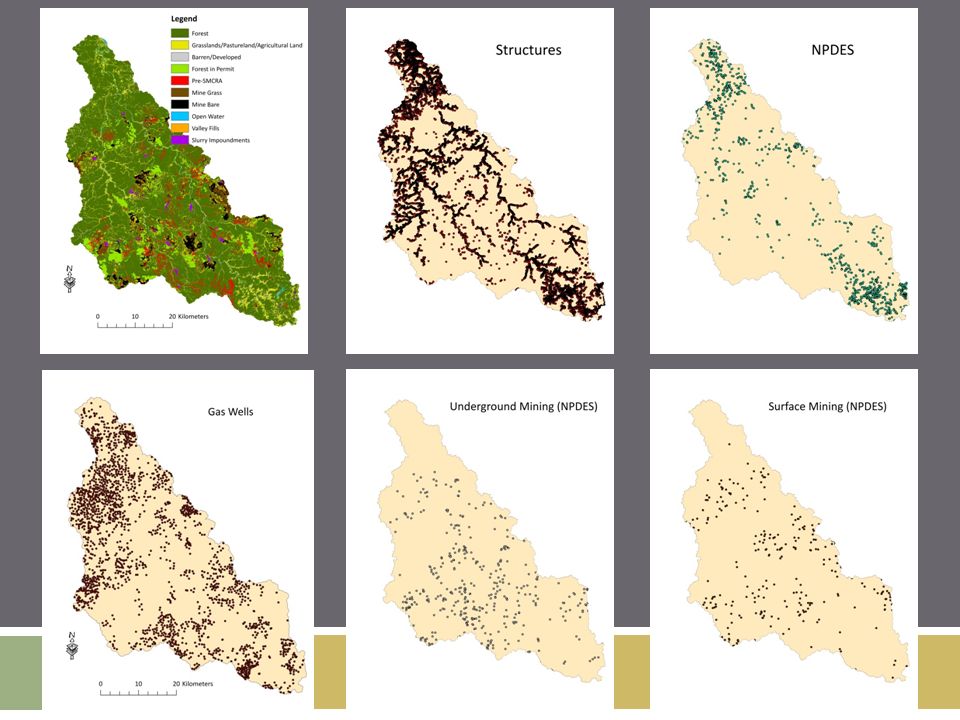
MiningDevelopmentNaturalOther UM NPDES (#/km 2 )Serviced Structures (#/km 2 )Basin Area (km 2 )%Grass/Pasture %AMLStruct not Serviced (#/km 2 )% Kanawha Coal%Barren/Dev %Reclaimed% Allegheny Coal%Forest %Active% Pocahontas CoalAll NPDES permits (#/km 2 ) %Valley Fills% New River CoalRoad Density (km/km 2 ) Well density (#/km 2 ) Landscape variables retained for use in global BRT models. C=cumulative. Landscape variables

16
Stream sampling design Closed circles = mined Open circles = developed Closed triangles = combined Open triangles = reference Size = relative deep mining

17
Physical habitatWater qualityMacroinvertebratesFishes MSWTemperatureWVSCIMAH IBI Mean depthpHGLIMPSSWV IBI CV depthDissolved oxygenTotal richnessTotal Richness LWD (#/m)ConductanceEPT richnessNative Richness DRF/MSWTotal AlkalinityE richnessBenthic Spawner R DFC/MSWBicarb. AlkalinityP richness% Intolerant RetentivenessAluminumT richness% Sculpin RVHA score (%)Calcium%EPTGame Fish Abund Clay/silt (%)Iron%EPT (no B) Sand (%)Cadmium%EPT (no H) Gravel (%)Chromium%E Cobble (%)Magnesium%E (no B) Boulder (%)Manganese%Tolerant Bedrock (%)Potassium%Dominant Sodium%Chironomidae Zinc%Hydropsychidae Barium Nickel Selenium Chloride Sulfate Nitrite/Nitrite Total phosphorous Total Dissolved Solids Stream variables
Calcium%EPTGame Fish Abund Clay/silt (%)Iron%EPT (no B) Sand (%)Cadmium%EPT (no H) Gravel (%)Chromium%E Cobble (%)Magnesium%E (no B) Boulder (%)Manganese%Tolerant Bedrock (%)Potassium%Dominant Sodium%Chironomidae Zinc%Hydropsychidae Barium Nickel Selenium Chloride Sulfate Nitrite/Nitrite Total phosphorous Total Dissolved Solids Stream variables.")
18
Boosted regression trees ConductivitySeleniumGLIMPSSWVSCIEPTRVHA # Trees330037502800985075002350 Var Explained92%80%86%80%76%33% CV Dev Explained75%57%54%51%46%9% CUM %Reclaimed31.719.8.... CUM %Forest18.8.31.032.833.226.7 CUM %Valley Fills12.643.7.... CUM %Grass/Past14.8.21.220.012.938.0 CUM UM NPDES13.0..... CUM %Barren Min9.126.1.... CUM %Allegh Coal.5.3.... Local %Forest.5.1.... Local %Grass/Past..10.8.7.4. CUM Serviced SD..9.4.13.910.7 CUM Roads..5.614.414.7. CUM No Service SD....8.7. Local %Barren/Dev..9.214.89.1. Local Serviced SD..4.6..24.6 CUM All NPDES..8.218.0..

19
CUM % Forest 20% CUM % Reclaimed 34% Stressor – Response: Conductivity

20
Current Conditions - Chemistry

21
Current Conditions - Biology

22
Southern Coal Fields Mitigation

23
Current conditions Random permit under review 15 permits under review All current permits Improved reclamation on new mines Reduced deep mine effects on conductivity Reduced residential effects on biological condition Alternative Future Scenarios

24
Surface Mine Permits

25
Conductivity Futures: Status Quo Reclamation Current 15 Permits All Permits 889 1013 14% 1439 62% # streams > 500 cond

26
Conductivity Futures: Reduced Deep Mine Effect Current RDME + 0 mining RDME + 15 889 670 25% 778 12% # streams > 500 cond

27
WVSCI Futures: Reduced Residential Effect Current Current w/ RRE RRE + All permits 1506 607 60% 1302 14% # streams impaired

28
Alternative Futures Summary

30
Scale Localized actions to produce watershed scale benefits Immediate actions to produce long term benefits Coupling restoration with new development decisions Final Comments

Similar presentations


 n.>")


 Standard Best Value (95 th or 5 th percentile) Worst Possible Value Expected Response to Degradation Total Taxa180 EPT Taxa120 %EPT91.90.>")


 Sound Science for Measuring Ecological Condition www.epa.gov/emap.>")