Download presentation
Presentation is loading. Please wait.

1
Learning Objectives Today we will Learn: The different types of test data

2
Normal Data Data that is within the normal range and will be accepted It is data that meets a format check It is data that is of the right type for the field

3
Extreme Data Data that is on the extreme limits of the range but should be accepted e.g. between 0 and 100. 0 and 100 are the extreme limits

4
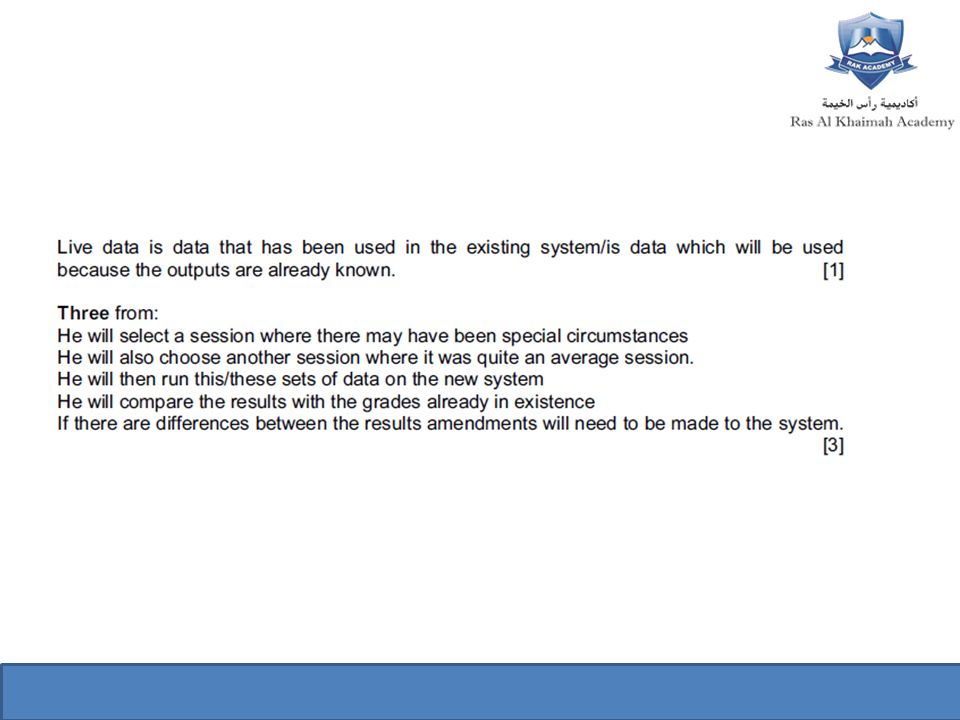
Live Data This is data that has been used in the existing system. It is used because the output of it is already known i.e. whether the system should accept or reject it. The live data will be entered and the output will be compared with the expected output.

5
Abnormal Data Data that should fail Data that is outside an acceptable range Data that does not meet the format check Data that isn’t the correct type of data for the field

7
Components Calculate total order, apply P&P. Authorise payment 2Payment Processing Process: A process is a business activity or function where the manipulation and transformation of data takes place.

8
Components D1 Orders Data Store: A data store represents the storage of data required and/or produced by the process. Here are some examples of data stores: membership forms, database table, etc.

9
Components Data Flow: A data flow represents the flow of information, with its direction represented by an arrow head that shows at the end(s) of flow connector.
 of flow connector.")
10
Context Diagram A context diagram, a simple representation of the whole system.

11
Context Diagram Draw a context diagram for Westford Stationary

12
Data Flow Diagram A data flow diagram shows additional information about the major functions of the system.

13
Data Flow Diagram Draw a Level 1 DFD for Westford Stationary

16
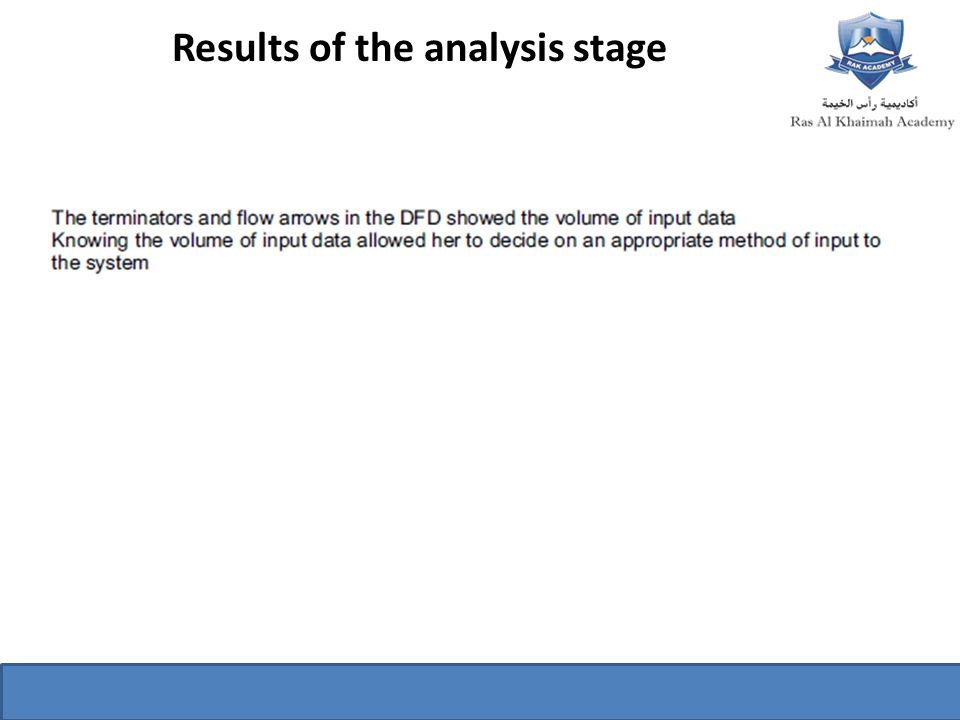
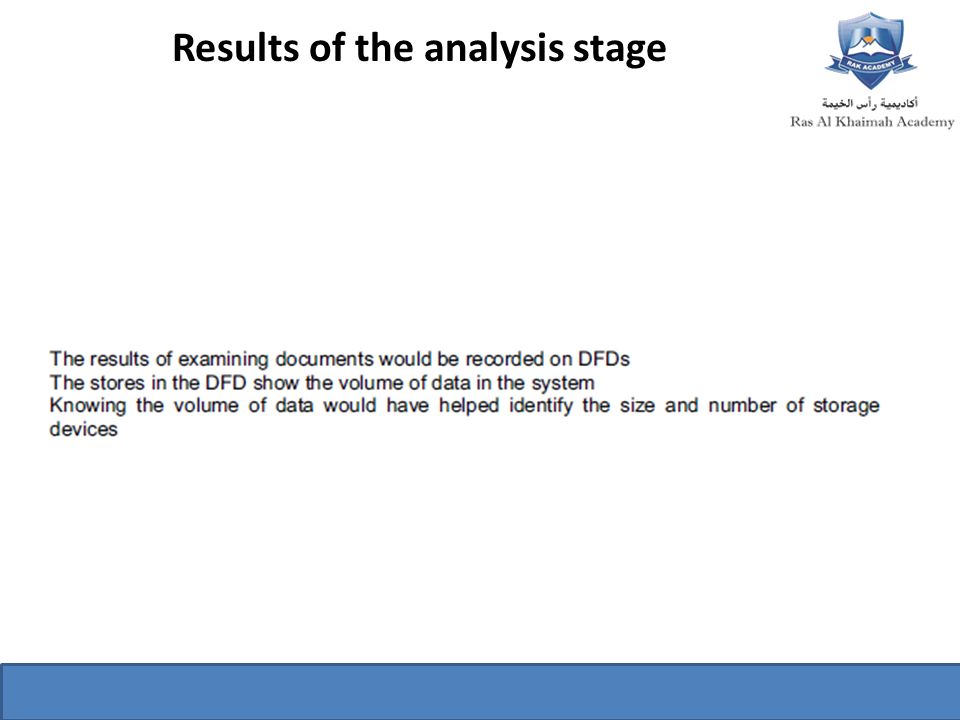
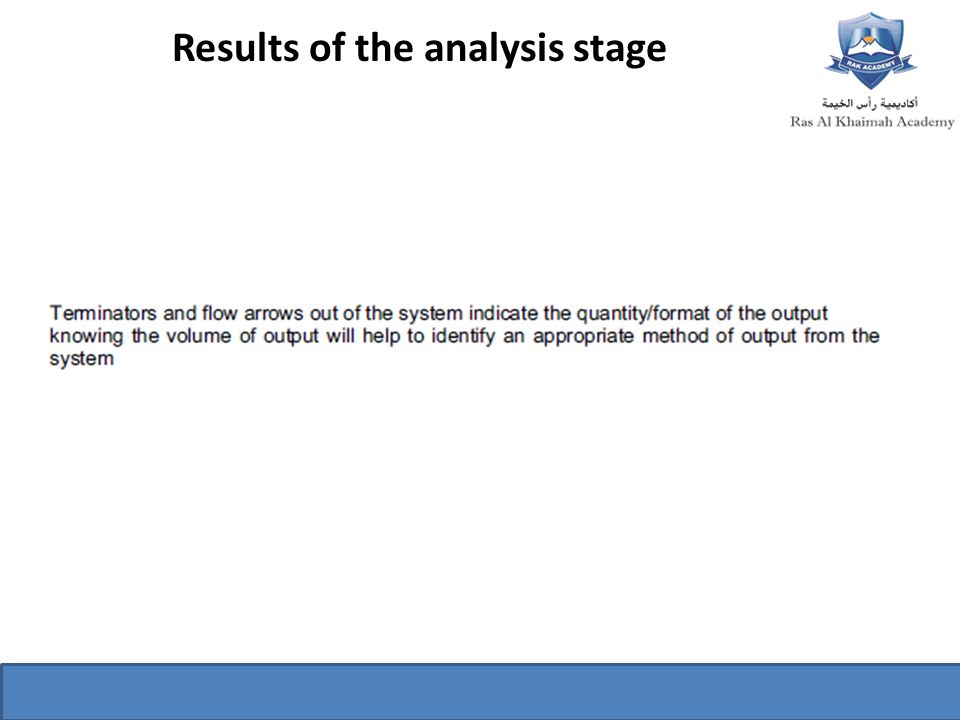
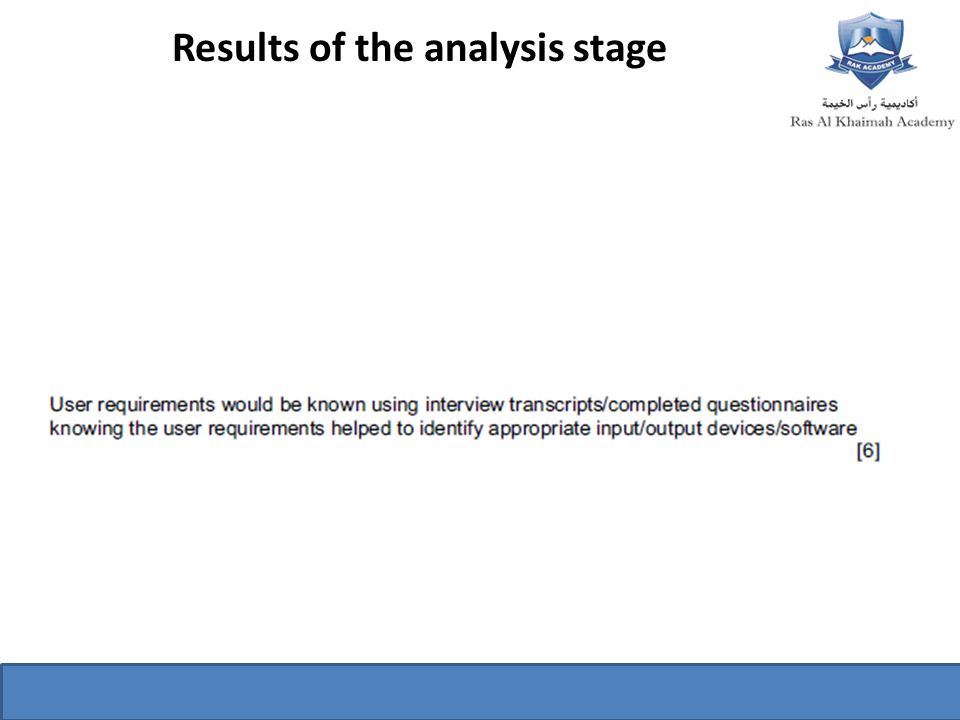
Results of the analysis stage

22
Components of a DFD Terminators, processes, flow arrows and stores

23
System Flowcharts Show the input/process/output like a data flow diagram but also display the hardware required for inputting data, processing data, outputting data and storing data. Examples: Input – Bar Code reader Output – Screen/Colour Printer Storage – Hard Disk Drive

24
Learning Objectives Today we will Learn: What a systems flow chart is The symbols of a systems flowchart The difference between a DFD and a Flow Chart

25
The Differnces The DFD helps identify the information requirements, as well as the inputs, processing, storage and output A systems flowcharts helps identify the hardware/software needed in the new system

26
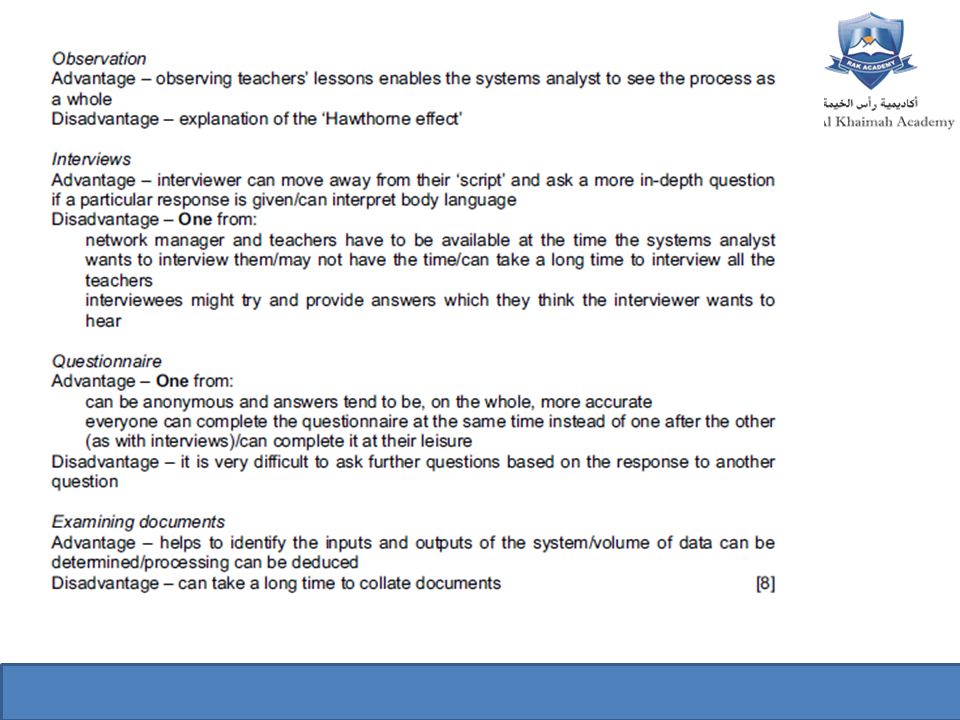
Output of the analysis stage How can we identify the hardware/software requirements from all the tasks completed in the analysis stage: Investigation – Interviews, observation, documents, questionnaires DFD diagrams, systems flow chart

27
Learning Objectives Today we will Learn: Why we need to design the data structures How to design the data structures

29
Learning Objectives Today we will Learn: Design techniques for designing screen layouts

30
Learning Objectives Today we will Learn: Design techniques for designing screen layouts

31
Learning Objectives Make it obvious where data needs to be entered, use boxes or different colours Vary the size of the boxes to indicate how much data needs to be entered Use drop down menus, radio buttons and checkboxes for limited choices Think about the order in which you want the user to enter data (tab key) – it must match the data collection form
 – it must match the data collection form")
32
Learning Objectives Build in data validation techniques to reduce errors Ask users to enter passwords and e-mail addresses twice for verification. What colours will be used? Think about house style and colours that are clear for the user The number of mouse clicks and key presses should be kept minimal

Similar presentations