Download presentation
Presentation is loading. Please wait.

1
___________________________ Characteristics of rural- urban elderly living in poverty ELDERLY IN MALAYSIA SAIDATULAKMAL MOHD, Ph.D. This study benefits from the financial support provided by the Social Security Research Center (SSRC), Universiti Malaya, Malaysia
, Universiti Malaya, Malaysia.")
2
Background of studyBackground of study Objectives of studyObjectives of study Data & FindingsData & Findings ConclusionConclusion

4
Traditional family structure broken down Difficult to maintain a decent life Decline in fertility rate, longer life expectancy An economic and social issue Aging population An increase in elderly population Change in family structure Increase in the cost of living

5
Percentage population aged 55 years an above increase from 7.6 percent in 1970 to 12.3 percent in 2012 2015 Malaysia’s population aged 65 years and above will be six percent of the total population Percentage population aged 55 years an above increase from 7.6 percent in 1970 to 12.3 percent in 2012 2015 Malaysia’s population aged 65 years and above will be six percent of the total population

8
Investigates the characteristics of the elderly living in the rural and urban areas) Identifies the elderly living in poverty based on the rural and urban areas Examines the factors influencing the poverty of elderly in each of the strata they live in
 Identifies the elderly living in poverty based on the rural and urban areas Examines the factors influencing the poverty of elderly in each of the strata they live in")
10
HIS 2009 data provided by the DOS 19,125 observations or elderly are used for the analysis (9,452 in rural and 9,673 in urban areas) Information on socio demographic profiles is provided at the household and individual levels
 Information on socio demographic profiles is provided at the household and individual levels")
11
Gender AGE Marital Status Ethnicity Education Strata Working Group Male : 48.05 Female : 51.91 58-59 : 14,74 60-64 : 30.79 65-69 : 21.36 70-74 : 16.59 75-79 : 8.47 80 & Above: 8.06 Married : 67.54 Others : 32.46 Bumiputera :63.39 Chinese : 30.58 Indian : 5.55 Others : 0.48 Urban : 50.56 Rural : 49.44 Primary : 42.60 Secondary : 18.37 Tertiary : 4.13 None : 34.90 Homemakers etc : 71.45 Senior officials & managers : 0.48 Professionals: 0.49 Technicians & associate professionals : 1.37 Clerical workers : 0.48 Skilled agriculture & fishery : 12.38 Craft & related trade: 2.07 Plant & machine operators : 1.66 Elementary occupations : 3.33

12
Gender AGE Marital Status Ethnicity Education Strata Working Group Male : 7.97 Female : 11.73 58-59 : 5.56 60-64 : 6.36 65-69 : 10.12 70-74 : 13.66 75-79 : 15.98 80 & Above: 16.90 Married : 7.40 Others : 15.17 Bumiputera :13.66 Chinese : 3.02 Indian : 5.17 Others : 10.99 Urban : 4.72 Rural : 15.24 Primary : 7.95 Secondary : 2.05 Tertiary : 0.63 None : 17.58 Homemakers etc :10.32 Senior officials & managers : 1.86 Professionals: 0.00 Technicians & associate professionals : 3.80 Clerical workers : 0.00 Skilled agriculture & fishery : 12.95 Craft & related trade: 5.79 Plant & machine operators : 2.84 Elementary occupations : 11.91

13
Gender AGE Marital Status Ethnicity Education Working Group Male : 49.44 / 50.56 Female : 49.45 / 50.55 58-59 : 13.75 / 15.70 60-64 : 29.65 / 31.90 65-69 : 21.25 / 21.46 70-74 : 17.44 / 15.75 75-79 : 9.19 / 7.76 80 & Above: 8.71 / 7.43 Married : 67.63 / 67.44 Others : 32.37 / 32.56 Bumiputera :84.41 / 42.83 Chinese : 12.12 / 48.65 Indian : 2.93 / 8.12 Others : 0.55 / 0.40 Primary : 46.68 / 38.61 Secondary : 9.93 / 26.63 Tertiary : 1.32 / 6.88 None : 42.07 / 27.88 Homemakers etc: 65.02 / 77.74 Senior officials & managers : 1.44 / 3.04 Professionals: 0.33 / 0.65 Technicians & associate professionals : 0.82 / 1.91 Clerical workers : 0.13 / 0.82 Skilled agriculture & fishery : 22.15 / 2.82 Craft & related trade: 1.69 / 2.45 Plant & machine operators : 1.14 / 2.16 Elementary occupations : 3.39 / 3.27

14
Gender AGE Marital Status Ethnicity Education Strata Working Group Male : 12.59 / 3.46 Female : 17.70 / 5.89 58-59 : 8.39 / 7.88 60-64 : 18.92 / 22.32 65-69 : 21.07 / 24.07 70-74 : 23.70 / 20.13 75-79 : 13.51 / 14.00 80 & Above: 14.41 / 11.60 Married : 52.53 / 43.54 Others : 47.47/ 56.46 Bumiputera :93.42/ 67.83 Chinese : 4.50 / 24.51 Indian : 1.66 / 6.78 Others : 0.42 / 0.88 Urban : 4.72 Rural : 15.24 Primary : 32.99 / 37.64 Secondary : 2.49 / 7.88 Tertiary : 0.07 / 0.88 None : 64.45 / 53.61 Homemakers etc: 72.49 / 80.09 Senior officials & managers : 0.49 / 0.22 Professionals: 0.00 / 0.00 Technicians & associate professionals : 0.49 / 0.66 Clerical workers : 0.13 / 0.00 Skilled agriculture & fishery : 19.82 / 4.60 Craft & related trade: 0.97 / 1.97 Plant & machine operators : 2.16 / 1.09 Elementary occupations : 2.98 / 7.22

15
Other Ethnicity is the reference category in ethnicity; No Education is the reference category in education; Other House Type is the reference category in House Whole sample (n = 19,125) Rural (n = 9,452 ) Urban (n = 9,673) CoefficientOdds RatioCoefficientOdds RatioCoefficientOdds Ratio HHSIZE-1.0683 a 0.3436 a -1.0049 a 0.3661 a -1.2501 a 0.2865 a CHILD0.8370 a 2.3094 a 0.7821 a 2.1861 a 0.9683 a 2.6336 a AGE0.0181 a 1.0183 a 0.0189 a 1.0190 a 0.0167 c 1.0168 c Primary-1.0011 a 0.3675 a -1.0139 a 0.3627 a -0.9475 a 0.3877 a Secondary-2.1843 a 0.1126 a -2.0955 a 0.1230 a -2.2936 a 0.1009 a Tertiary-3.5165 a 0.0297 a -3.9625 a 0.0190 a -3.3940 a 0.0336 a Bumiputera0.49451.63980.8734 c 2.3951 c -0.32670.7213 Chinese-0.9449 b 0.3887 b -0.60240.5474-1.7577 a 0.1724 a Indian-0.0611 c 0.9407 c 0.31521.3704-0.81510.4426 HHRelation0.4577 a 1.5804 a 0.4295 a 1.53640.5009 a 1.6503 a STRATA0.6837 a 1.9812 a NA Owned-1.1062 a 0.3308-0.8480 b 0.428251 b -1.6264 a 0.1966 Rented-0.8748 a 0.4169-0.7788 a 0.458978 a -1.2987 a 0.2729 a Squatter Owned0.9112 b 2.48721.446 b 4.249332 b 0.31201.3662 Squatter Rented-0.00790.99210.46441.5911330.46410.6287
 Rural (n = 9,452 ) Urban (n = 9,673) CoefficientOdds RatioCoefficientOdds RatioCoefficientOdds Ratio HHSIZE a a a a a a CHILD a a a a a a AGE a a a a c c Primary a a a a a a Secondary a a a a a a Tertiary a a a a a a Bumiputera c c Chinese b b a a Indian c c HHRelation a a a a a STRATA a a NA Owned a b b a Rented a a a a a Squatter Owned b b b Squatter Rented")
17
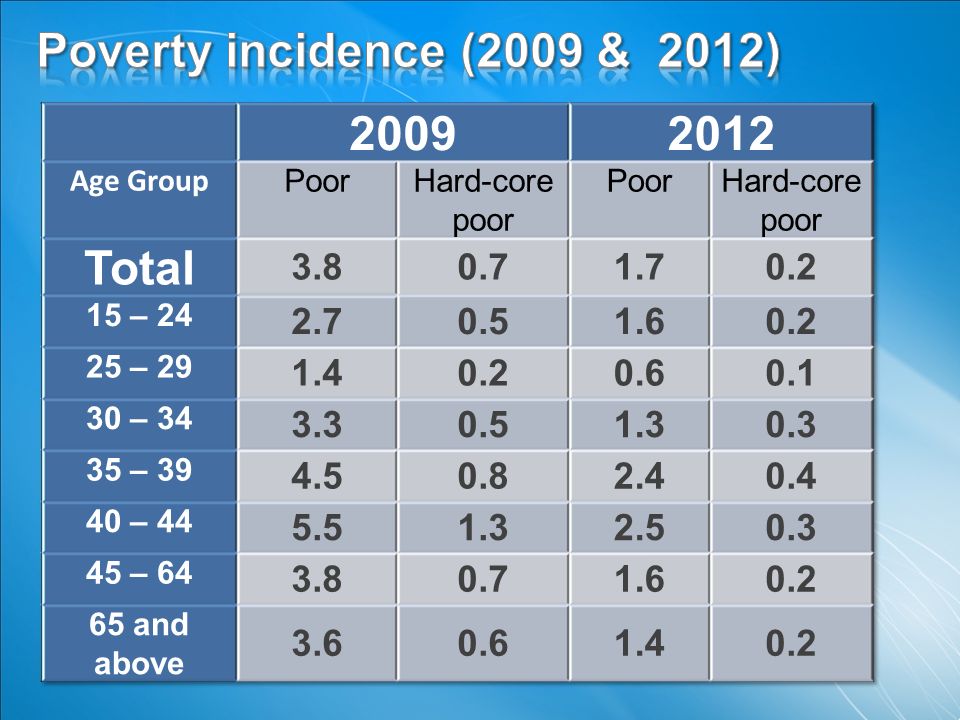
This study had empirically demonstrated that elderly’s poverty incidence is still at a relatively low level Nevertheless, poverty incidence in the rural area is relatively high, more than three times higher than the urban areas. The logistic probability estimation indicates that the many factors influencing elderly poverty include household size, presence of young child in a household, age, education attainment, strata and house ownership

18
Education has important role in reducing poverty: with education, the probability of poverty could be reduced, regardless on the type of education, let them be primary, secondary and tertiary Role of wealth in reducing poverty: house ownership is an example of wealth acquisition and this is an important element to reduce poverty Ethnicity remains an issue in poverty: being a Bumiputera is susceptible to be poor in the rural areas while being a Chinese has a higher probability to be out of poverty in the urban area

Similar presentations


>")


, UNFPA – India>")


