Download presentation
Presentation is loading. Please wait.

1
Hypothesis Testing Involving One Population Chapter 11.4, 11.5, 11.2

2
Review of Hypothesis Testing The purpose of hypothesis testing is to see if sample data is “strong” enough to reject a null hypothesis. The null hypothesis represents a current belief, the status quo, regarding a population parameter (like a population mean). We have studied hypothesis test problems that provide a population standard deviation, σ. We will now study hypothesis test problems that provide a sample standard deviation, s.
. We have studied hypothesis test problems that provide a population standard deviation, σ. We will now study hypothesis test problems that provide a sample standard deviation, s..")
3
Sample Standard Deviation When constructing confidence intervals in which the sample standard deviation was given instead of the population standard deviation… We used t-scores instead of z-scores, and the distribution was a t- distribution instead of a normal distribution. Similarly with hypothesis testing, we will use t-scores when the problem gives us a sample standard deviation instead of a population standard deviation. Formulas for using the t-distribution: The sample t-score formula replaces the z-score formula: The estimation of the standard error is used instead of the standard error.

4
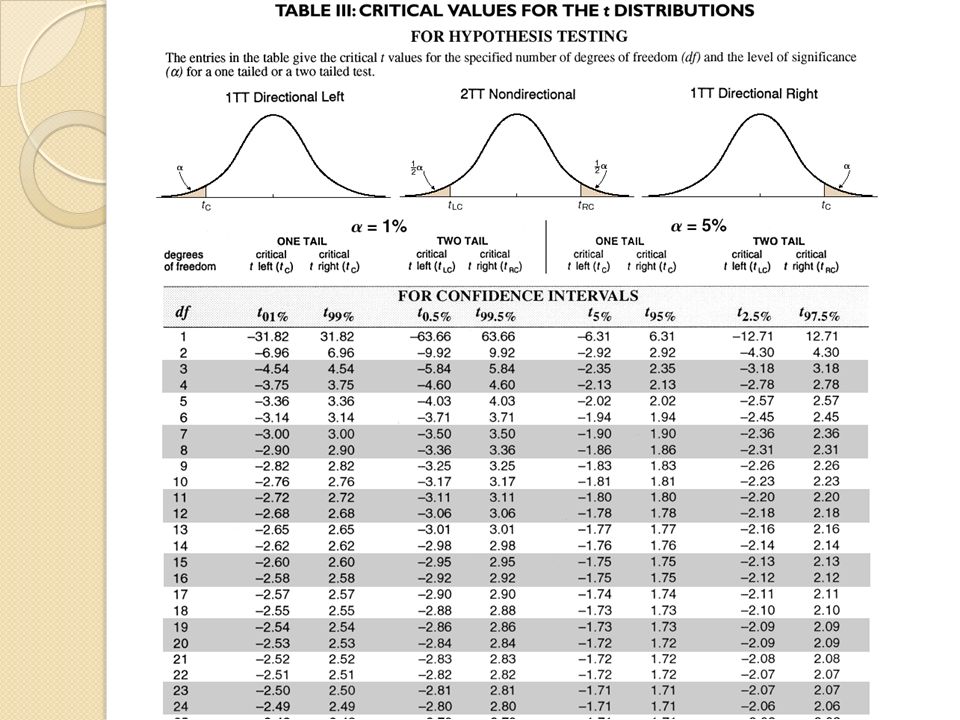
Using the T-Distribution To find the critical t-score, t c, in conducting a hypothesis test, we refer to Table III, page 808 with the following information in mind: 1. The significance level, α, that the problem provides. 2. The type of hypothesis test, either a 1TT and know it’s direction, or a 2TT. 3. The degrees of freedom found with the formula: Degrees of freedom, df = n - 1

5
Example 11.15 American Computer Machines, a large computer firm, has branch offices in several major cities of the world. From past experience, ACM knows that the average relocation time of its employees is ten years. Due to recent population trends, the company wants to determine if the average relocation time has changed (that is, is the average relocation time different from ten years?). To determine if a change has occurred, a random sample of 25 employees were interviewed and it was found that their mean relocation time was 9.5 years with s = 4.5 years. Does this sample result indicate a change has occurred in the mean relocation time? ( α =5%)
. To determine if a change has occurred, a random sample of 25 employees were interviewed and it was found that their mean relocation time was 9.5 years with s = 4.5 years. Does this sample result indicate a change has occurred in the mean relocation time. ( α =5%).")
6
Example 11.15 – traditional approach Step 1: Formulate the hypotheses. H 0 : The population mean relocation time is 10 years. H 0 : μ =10 H a : The population mean relocation is not 10 years. H a : μ ≠10

7
Example 11.15 – traditional approach Step 2: Determine the model to test the null hypothesis, H 0. Identify the model distribution, degrees of freedom, Since σ is unknown and is estimated by s, we will use the t-distribution. df = n-1 df =25 – 1 = 24 Mean: Estimate of the standard error:

8
Example 11.15 – traditional approach Step 3: Formulate the decision rule. Is the test direction or non-directional? Non-directional, because the company is testing whether the mean relocation time has decreased or increased ( μ ≠10) We have a 2 tailed test, with α =5%. To find the critical t-scores, use the t- distribution table (page 808) noting that this is a 2TT with α =5% and df=24.
 We have a 2 tailed test, with α =5%. To find the critical t-scores, use the t- distribution table (page 808) noting that this is a 2TT with α =5% and df=24..")
10
Example 11.15 – traditional approach The critical t-scores are t LC = -2.06 and t RC = 2.06 Step 3: Formulate the decision rule. Reject the null hypothesis if the t-score of the sample mean is either less than -2.06 or greater than 2.06.

11
Example 11.15 – traditional approach Step 4: Analyze the sample data The sample mean The t-score of the sample mean, t, using from step 2 is:

12
Example 11.15 – traditional approach Step 5: State the conclusion. Since the t-score of the sample mean, t = - 0.56 falls between the critical t scores of - 2.06 and 2.06, we fail to reject H 0 at α =5% t = -0.56

13
Example 11.15 – traditional approach Answer the question. Does this sample result indicate a change has occurred in the mean relocation time? The company cannot conclude that the mean relocation time of 10 years has changed.

14
Page 803

15
Example 11.16 – p-value approach The IRS claims that the mean amount of time it takes to transfer tax information from a tax return to a computer record is 35 minutes. Before they will invest into a new system, they decide to do a test run to determine if the new system is significantly better than the present system. Four hundred tax returns are randomly selected and the data is transferred using the new system. The mean amount of time it takes to transfer the data from a tax return to a computer record is 34.3 minutes with s=4.2 minutes. Based upon this sample result, should the IRS invest in the new system? (Use α =1%)
.")
16
Example 11.16 – p-value approach Step 1: Formulate the hypotheses. H 0 : The population mean amount of time it takes to transfer tax information from a tax return to a computer record is 35 minutes. H 0 : μ =35 H a : The population mean amount of time it takes to transfer tax information from a tax return to a computer record is less than 35 minutes. H a : μ <35

17
Example 11.16 – p-value approach Step 2: Determine the model to test the null hypothesis, H 0. Identify the distribution, degrees of freedom, Since σ is unknown and is estimated by s, we will use the t-distribution. Degrees of freedom are not needed when using the p-value approach. The mean is not needed when using the p-value approach. Estimate of the standard error is not needed when using the p-value approach.

18
Example 11.16 – p-value approach Step 3: Formulate the decision rule. Is the test direction or non-directional? directional, because the IRS wants to test if the mean decreases ( μ <35) Reject H 0 if p-value of the sample mean is less than α =1%. α =1%
 Reject H 0 if p-value of the sample mean is less than α =1%. α =1%.")
19
Example 11.16 – p-value approach Step 4. Analyze the sample data. (find the p- value of the sample mean) STAT TESTS T-Test Step 5. State the conclusion. Since the p- value of the sample mean, 4.691E-4, is less than α = 1%, we reject H 0 at α = 1%. Yes, the IRS should invest in the new system.
 STAT TESTS T-Test Step 5. State the conclusion. Since the p- value of the sample mean, 4.691E-4, is less than α = 1%, we reject H 0 at α = 1%. Yes, the IRS should invest in the new system..")
20
homework question at α = 5%? at α = 1%?

21
The Sampling Distribution of the Proportion The sampling distribution of the mean is a collection of all possible samples means of size n taken from the original population. Sample means are denoted by The sampling distribution of the proportion is a collection of all possible proportions of size n taken from the original population. Sample proportions are denoted by

22
Some claims involving proportions The Bureau of Statistics claims that 75% of new small businesses will go bankrupt within ten months. A sociologist claims that two out of three couples that wed this year will divorce within five years. Educational Research Associates (ERA) claims that at least 40% of the male graduates of the State University have a reading level below 9 th grade. These claims do not refer to a population mean. These are the kind of claims that are tested in a hypothesis test involving a population proportion.
 claims that at least 40% of the male graduates of the State University have a reading level below 9 th grade. These claims do not refer to a population mean. These are the kind of claims that are tested in a hypothesis test involving a population proportion..")
23
H o and H a Involving a Population Proportion For a test involving a population proportion, the null hypothesis will always be of the form: H 0 : p = p 0 Where p 0 is some numerical value for the population proportion stated in the problem. (ex: p 0 =0.75 for a proportion of 75%) The alternative hypothesis will either be H a : p > p 0 (p is greater than p 0 ) H a : p < p 0 (p is less than p 0 ) H a : p ≠ p 0 (p is not equal to p 0 )
 The alternative hypothesis will either be H a : p > p 0 (p is greater than p 0 ) H a : p < p 0 (p is less than p 0 ) H a : p ≠ p 0 (p is not equal to p 0 ).")
24
Testing Model for a Population Proportion As part of the hypothesis test involving a proportion, we must determine the model to test the null hypothesis, H 0 Since we are testing a hypothesis about a population proportion, our model will be the sampling distribution of the proportion. In this step we also identify the mean and calculate the standard error. The symbols and formulas used to denote the mean and standard error of the sampling distribution of the proportion are mu-sub-p-hat and sigma-sub-p-hat:

25
Hypothesis Testing Procedure Involving a Population Proportion The z-score of the sample proportion is found with the formula:

26
Example 11.4 – traditional approach An advertising agency developed the theme for the commercials for the day time soap: The Nights of Our Lives on the assumption that 80% of its viewers are women. The ad agency would consider changing the theme of the commercials if the proportion of women viewers is significantly lower than 80%. To test this population proportion, the ad agency conducted a random survey of 400 viewers of this show and determined that 311 of these viewers were women. Based upon this sample proportion, should the ad agency change the theme of the commercials at α =5%?

27
Example 11.4 – traditional approach Step 1: Formulate the hypotheses. Null hypothesis in words: H 0 : The population proportion of women viewers who watch the day time soap The Nights of Our Lives is 0.80. Null hypothesis symbolically: H 0 : p=0.80 Alternative hypothesis in words: H a : The population proportion of women viewers who watch The Nights of Our Lives is less than 0.80. Symbolically: H a : p<0.80

28
Example 11.4 – traditional approach Step 2: Determine the model to test the null hypothesis, H 0. The model we will be using is the sampling distribution of the proportion. The mean of the sampling distribution of the proportion is: The standard error of the proportion is:

29
Example 11.4 – traditional approach Step 3: Formulate the decision rule. Directional or non-directional? Directional, because our H a uses the words less than, so this is a 1 tailed test. Will the significant tail be on the right or left? On the left side. For a significance level α =5%, what is the critical z-score for a 1 tailed test on the left? z c = -1.65

30
Example 11.4 – traditional approach Step 3: Formulate the decision rule. The decision rule is: Reject H 0 if the z-score of the sample proportion is less than -1.65.

31
Example 11.4 – traditional approach Step 4: Analyze the sample data Using the sample data, compute the sample proportion, p-hat: Finding the z-score for 0.7775: Our test statistic is -1.13.

32
Example 11.4 – traditional approach Step 5: State the conclusion. The z-score of the sample proportion, -1.13 is not less than the critical z-score value of -1.65, therefore we fail to reject H 0 at α =5%. Therefore, the ad agency should not change the theme of the commercials for The Nights of Our Lives.

33
Example 11.6 – p-value approach A biochemist has developed a new drug which he claims is more effective in the treatment of a skin disorder than the existing drug. Using the existing drug only 30% of the people contracting this skin disorder recover completely. To test his claim, he administers this new drug to a sample of 300 people who have contracted the skin disorder. The biochemist determines that 110 patients in his sample show a complete recovery. Based on this sample result, can the biochemist conclude at α =1% that his new drug is more effective than the existing drug in the treatment of this skin disorder?

34
Example 11.6 – p-value approach Step 1 H 0 : The population proportion of people who completely recover from this skin disorder using the new drug is 0.30. p=0.30 H a : The population proportion of people who completely recover from this skin disorder using the new drug is greater than 0.30. p>0.30

35
Example 11.6 – p-value approach Step 2: Determine the model to test H 0 We will be using the sampling distribution of the proportion. It is not necessary to state the mean of the sampling distribution of the proportion. It is not necessary to state the standard error of the sampling distribution of the proportion

36
Example 11.6 – p-value approach Step 3: Decision rule We have a directional test since H a is trying to show p>0.30. Decision rule: Reject H 0 if the p-value of the sample proportion is less than α =1%. z=0

37
Example 11.6 – p-value approach Step 4: Analyze the sample data (find the p-value of the sample proportion.) STAT TESTS 1-PropZTest Step 5. State the conclusion. Since the p-value of the sample proportion, 0.0059, is less than α = 1%, we reject H 0 and accept H a at α = 1%. The biochemist can conclude that his new drug is more effective than the existing drug in the treatment of the skin disorder

Similar presentations


>")

>")


>")
