Download presentation
Presentation is loading. Please wait.

1
Summary of Gap Causes and Where the Most Prominent Gaps Are in Kansas Tony Moss Researcher / Data Analyst Kansas State Dept. of Education Gap Workgroup Meeting KSDE, 24 Sept 2014

2
In our first meeting, we reviewed research and data which confirmed that: 1.Gaps are leading indicators of the health and competitiveness of a society. The smaller the gaps, the healthier and more economically competitive the society. The rapid growth in the proportion of working and single mothers is a global phenomenon, but countries that have high-quality Early Education and Child Care (EECC), have reduced the gaps associated with poverty and single-parenthood. 2.Health and academic gaps, because of developmental sensitivities, originate in early child development and social interactions. Once the architecture of developing brains and biological systems is shaped, gradients in health and achievement persist. Plasticity is limited.
, have reduced the gaps associated with poverty and single-parenthood. 2.Health and academic gaps, because of developmental sensitivities, originate in early child development and social interactions. Once the architecture of developing brains and biological systems is shaped, gradients in health and achievement persist. Plasticity is limited..")
3
The brain is sculpted by experience, especially so from birth through age 5. This foundational architecture shapes some capacities for life.

4
3.Sub-optimal architecture increases the probability of lower academic performance, heart disease, diabetes, mental illnesses, and criminal behaviors. 4.As income and wealth gaps have increased over the last three decades, the upper classes are investing more in their children, increasing academic gaps by 30 to 60 percent. 5.Social and Economic Status (SES) has become a much stronger predictor of gaps than ethnicity or race. Lower SES is disproportionately greater among African-Americans and Hispanics. Review continued:
 has become a much stronger predictor of gaps than ethnicity or race. Lower SES is disproportionately greater among African-Americans and Hispanics. Review continued:.")
5
The 3 most important early factors for a child’s future academic success are: Rich language & intellectual stimulation and reciprocity Warm, positive bonding & attachment & emotional reciprocity Normal, not chronically stressful or neglectful, social environments

6
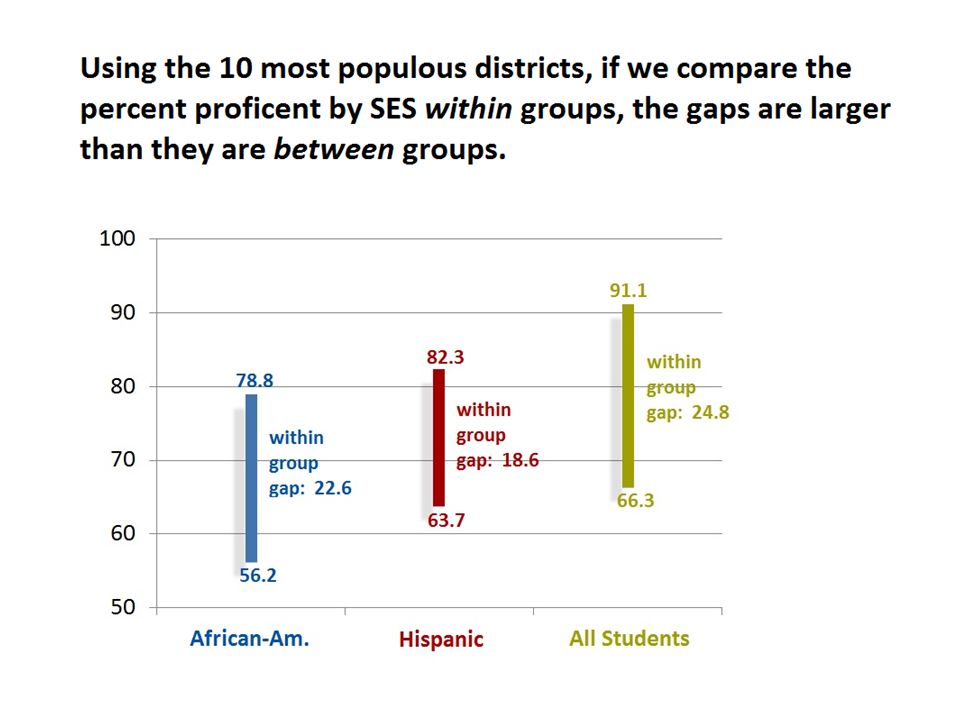
Where are the biggest gaps and what solutions might be tested there? Which ten Kansas districts have the greatest numbers of Hispanics, African-American, and lower SES students? How well are these 3 overlapping groups performing academically? Do the descriptive facts of these districts and schools fit with our causal hypotheses? In Kansas, is poverty a stronger predictor of lower academic results than ethnicity?

7
Where are the greatest numbers of each of the 3 groups?

8
How well do African-American students do on state reading assessments in these 10 districts?

9
Where are the greatest numbers of Hispanic students?

10
How well do Hispanic students do on state reading assessments in their 10 most populous districts?

11
Where are the greatest numbers of lower social & economic status students?

12
How do the ethnic groups’ relative risks compare to those of lower-income students? Is the pattern the same?

14
In Kansas, is lower SES a stronger predictor of academic achievement than ethnicity? Dependent or Predicted Variable : Cumulative Academic Percentile Rank Based on Available State Assessments school-level predictors:environment (urban, suburban, town, rural) size of school (by percentile) local poverty (percent of students receiving free or reduced lunch) percent of student body that is African-American percent of student body that is Hispanic percent of student body classified as English Language Learners percent of student body that are Students with Disabilities student-level predictors:current poverty: Is the student classified as free or reduced lunch this year? cumulative poverty: the number of years the student has received free or reduced lunch gender cumulative times the student has been declared with a disability cumulative times the student has been declared an English Language Learner mean rate of absence, all available years number of times student changed schools, current year cumulative times the student has been declared truant the students ethnicity or race (African-American, Hispanic, White, Other)
 size of school (by percentile) local poverty (percent of students receiving free or reduced lunch) percent of student body that is African-American percent of student body that is Hispanic percent of student body classified as English Language Learners percent of student body that are Students with Disabilities student-level predictors:current poverty: Is the student classified as free or reduced lunch this year. cumulative poverty: the number of years the student has received free or reduced lunch gender cumulative times the student has been declared with a disability cumulative times the student has been declared an English Language Learner mean rate of absence, all available years number of times student changed schools, current year cumulative times the student has been declared truant the students ethnicity or race (African-American, Hispanic, White, Other).")
15
What variables were significant predictors of students’ average academic growth? (same predictors, reading and math combined)
.")
16
If we know that poverty is having a stronger effect than race, our targeting ought to include poverty. Number of Below proficient, Lower-Income Students

17
By this targeting criteria, half of the identified African-American and Hispanic districts match, including 3 of the largest. Number of Below proficient, Lower-Income Students

18
If we select the districts with the largest numbers of below proficient and low-income students, regardless of race, we get these districts: Number of Below proficient, Lower-Income Students

19
Overlap of Kansas Districts with the Largest Numbers of Below-Proficient & Low-Income Students by Ethnic Group

Similar presentations

 Childhood poverty is a major problem in the US –Over 22% of children in the US live in poverty as compared to 9% in.>")


 Tamara Halle, Nicole Forry, Elizabeth Hair & Kate Perper.>")


Women generally need more health care than men because.>")


