Download presentation
Presentation is loading. Please wait.

1
W.C. Rusty Riese, PhD Adjunct Professor, Rice University

2
What are we being told? What are the data? What are the take-aways?

3
Mann “Hockey Stick” Curve

5
The Arctic is melting

6
Stumps have been thawing from beneath the Mendenhall Glacier for about 50 years, but recently, considerably more have been found in upright positions with roots still intact. LiveScience, 9/20/2013 Glaciers are retreating

7
Sea levels will rise

8
Coastal cities will be inundated

9
Tropical storms numbers and intensity will increase

10
Tornados will become more frequent and intense

11
Precipitation will increase in frequency and severity

12
Famines will kill millions of people

13
But what do the data show?

18
The most common reference points are 1820, 1850, or 1880 1820 Corresponds to the end of the “Little Ice Age”

19
If we change the reference point to the Medieval Maximum Then we are only just recovering from the “Little Ice Age”

20
Not Medieval Climate Crisis Medieval Climate Optimum

21
Modern Climate Optimum Why Call This A Climate Crisis?

22
Average Temperature Profiles Differ Slightly by Agency NASAHadley NOAA

23
New Zealand Processed Data New Zealand Raw Data Data Manipulation

26
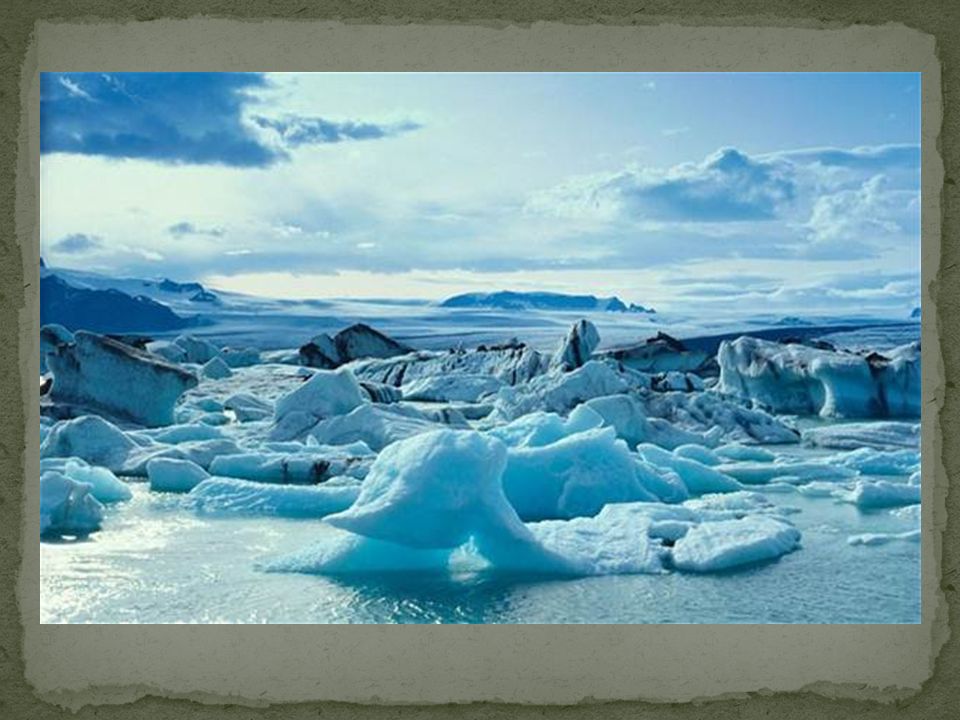
So, is the Arctic melting?

30
Are glaciers retreating?

33
Archeologists from the Danish National Museum have now proven that Eric the Red, who founded the Icelandic settlement in Greenland at the end of the tenth century AD, and his contemporaries were able to brew ale* DailyNews, 1/30/2012 A barley field in Iceland. Photo by Páll Stefánsson

34
Jan. 23, 2013 — A new study provides surprising details on changes in Earth's climate during the last warm period (120,000-128,000 years ago). Even though temperatures in Northern Greenland were 5-8 degrees Celsius higher than today, the thickness of the ice sheet was only a few hundred meters lower. And this despite the fact that sea level was 4-8 metres higher than today. Science News & Niels Bohr Institute
. Even though temperatures in Northern Greenland were 5-8 degrees Celsius higher than today, the thickness of the ice sheet was only a few hundred meters lower. And this despite the fact that sea level was 4-8 metres higher than today. Science News & Niels Bohr Institute.")
35
Is sealevel rising? Increases are following the 150 year trend

36
Have tropical storms become more frequent or intense?

37
Have tornados become more frequent and intense?

38
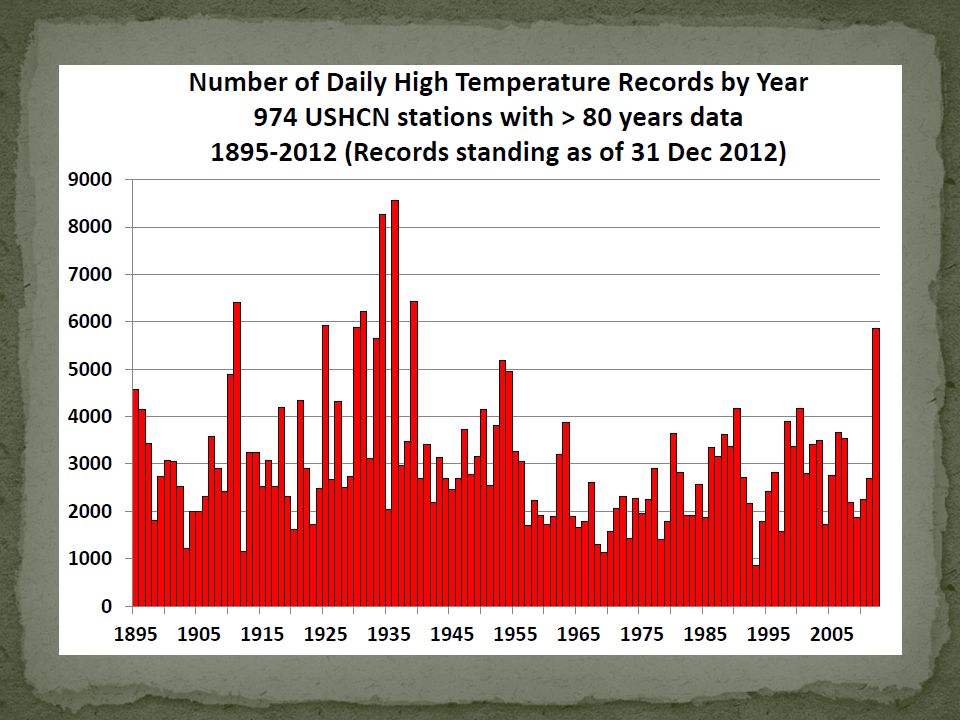
Has precipitation changed in intensity or severity?

40
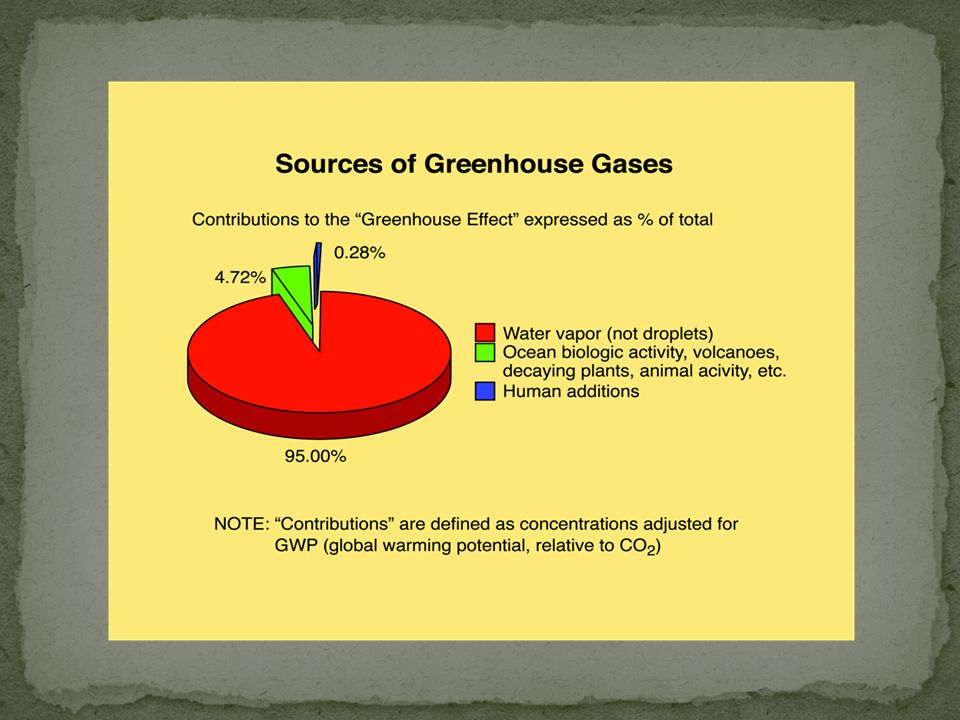
So, does atmospheric CO2 really drive climate change?

43
5 th IPCC report, January 30, 2014

46
Christopher Monckton, WUWT, 9/11/2013

49
CET temperatures have been plummeting over the last 13 years (fall 2013 data not included). Chart by Ed Hoskins, data source: UK Met Office. - See more at: http://notrickszone.com/2013/09/12/no-warming-left-to-deny-global-cooling-takes- over-cet-annual-mean-temperature-plunges-1c-since-2000/#sthash.ZF1mvbNI.dpuf

50
Mann “Hockey Stick” Curve WRONG

51
What then is driving climate change?

53
After Svensmark re Laken et al. 2010 Image: Jo Nova

58
Just the Facts Global Warming Sea Level Increase Historical rate of 0.07 inches/year not catastrophic May go down No more droughts or storms than normal Ice melting is normal for interglacial periods

59
Just the Facts Global Warming CO 2 Is Not The Cause of Global Warming Temperature increases cause CO 2 increases Solar Activity Has a Stronger Impact Changes in Oceanic Circulation Have a Stronger Impact

60
Just the Facts Global Warming From mid 1800’s to 1998 Temperatures increased 0.8 o C From 1998 to 2007 Temperatures were flat From 2007 to 2012 Temperatures fell 0.02 to 0.03 o C CAUTION: Above Statements based on Global Averages

61
The Arctic seems to be warming up. Reports from fishermen, seal hunters, and explorers who sail the seas about Spitzbergen and the eastern Arctic, all point to a radical change in climatic conditions, and hitherto unheard-of high temperatures in that part of the earth's surface. The Arctic is Melting 1922

62
“…A change in our climate is taking place very sensibly." Snowfall has become "less frequent and less deep." Rivers that once "seldom failed to freeze over in the course of the winter, scarcely ever do so now." And this is having an especially worrisome effect on the food supply: "This change has produced an unfortunate fluctuation between heat and cold, in the spring of the year, which is very fatal to fruits." "Notes on the State of Virginia" by Thomas Jefferson, 1785.

63
“No amount of experimentation can ever prove me right; a single experiment can prove me wrong.” Albert Einstein

67
Extra slides

70
Actual Average Temperature Scaled in whole Degrees Global Mean Temperatures: 1880 - 2003 John Grisham, Source; NASA

71
arctic.atmos.uiuc.edu/cryosphere/timeserie s.anom.1979-2008

74
The Arctic is melting Glaciers are retreating Sea levels will rise Coastal cities will be inundated Tropical storms numbers and intensity will increase Tornados will become more frequent and intense Precipitation will increase in frequency and severity Famines will kill millions of people

75
Greenland was Green when it was discovered in 876 Greenland Ice Disappearing Headlines Been There, Done That 876

76
Antarctic sea ice extent on September 22 compared to 1981-2010 median depicted by orange curve (NSIDC)
")
78
Global Warming Real Crisis? Alarmist Hype? Fraud? Climategate

Similar presentations


 climate change is on a timescale of decades, an example would.>")
>")
![Climate Change Impacts in the United States Third National Climate Assessment [Name] [Date] Climate Trends.](/15/4626683/big_thumb.jpg "Climate Change Impacts in the United States Third National Climate Assessment [Name] [Date] Climate Trends.>")


