Download presentation
Presentation is loading. Please wait.

1
2013-2014 Academic Year – Dawson Springs Independent

2
Forwarding Student Achievement and Development Every Student, Every Day

3
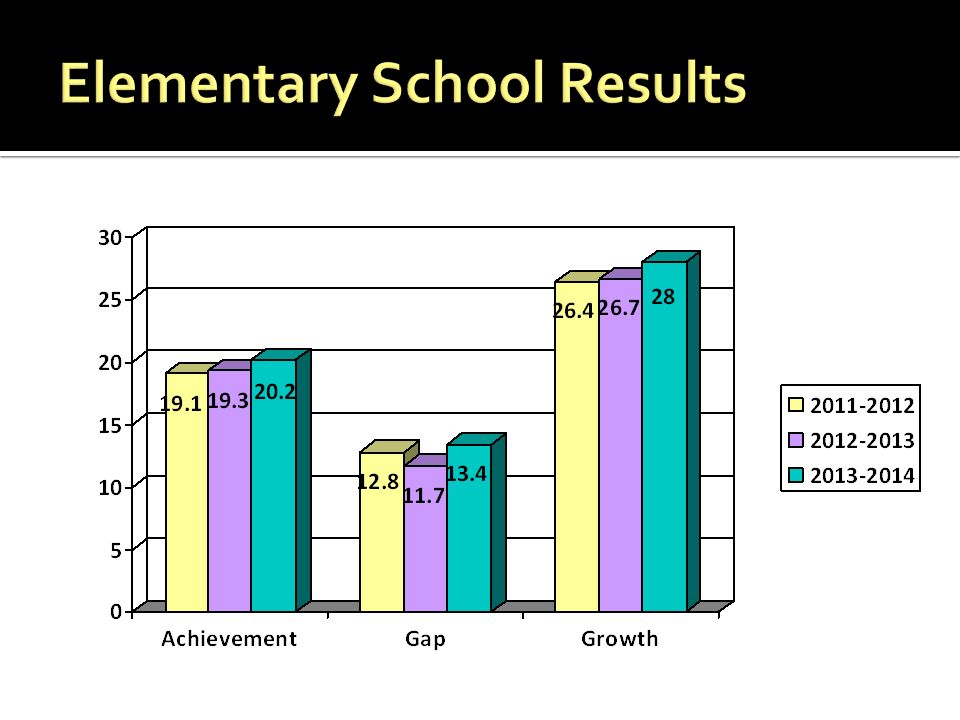
Achievement Gap Growth 30 40

4
Achievement Gap Growth C/C Readiness 28 16

5
Achievement Gap Growth C/C Readiness Graduation 20 ** percentages

6
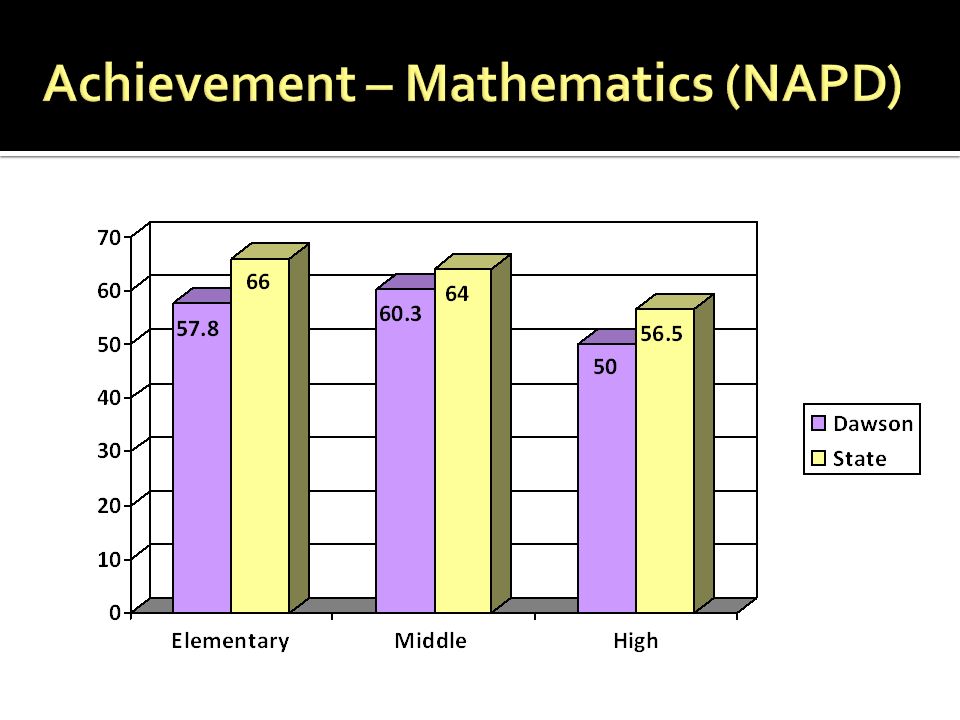
Achievement ReadingMathScienceSoc. St.WritingLang. Mech. All content areas are 20% each, with Writing and Language Mechanics combining for 20% 20 164

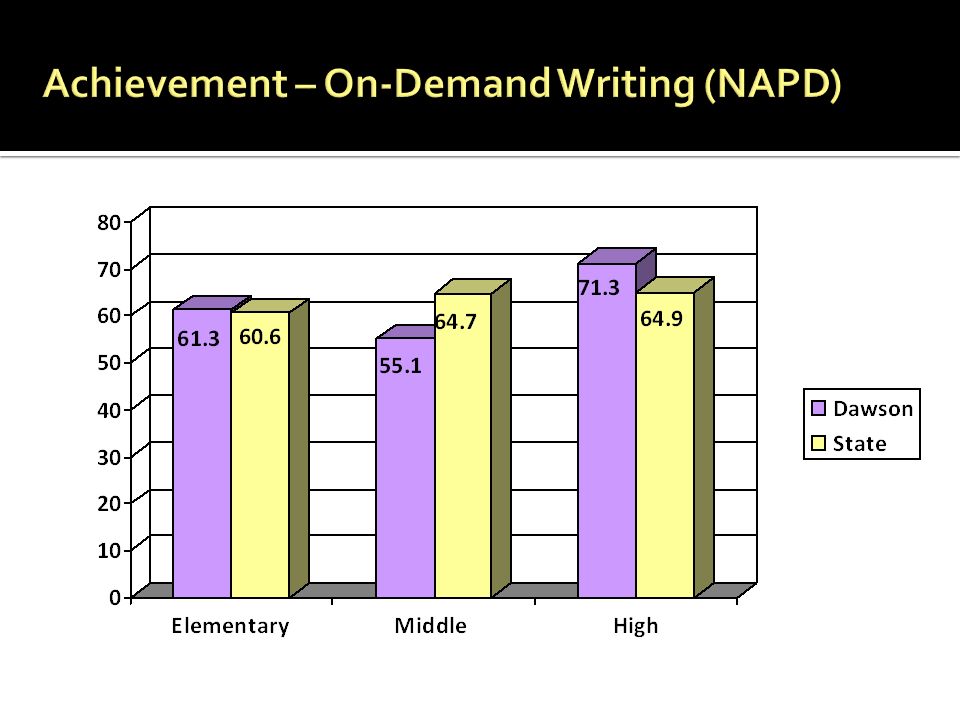
7
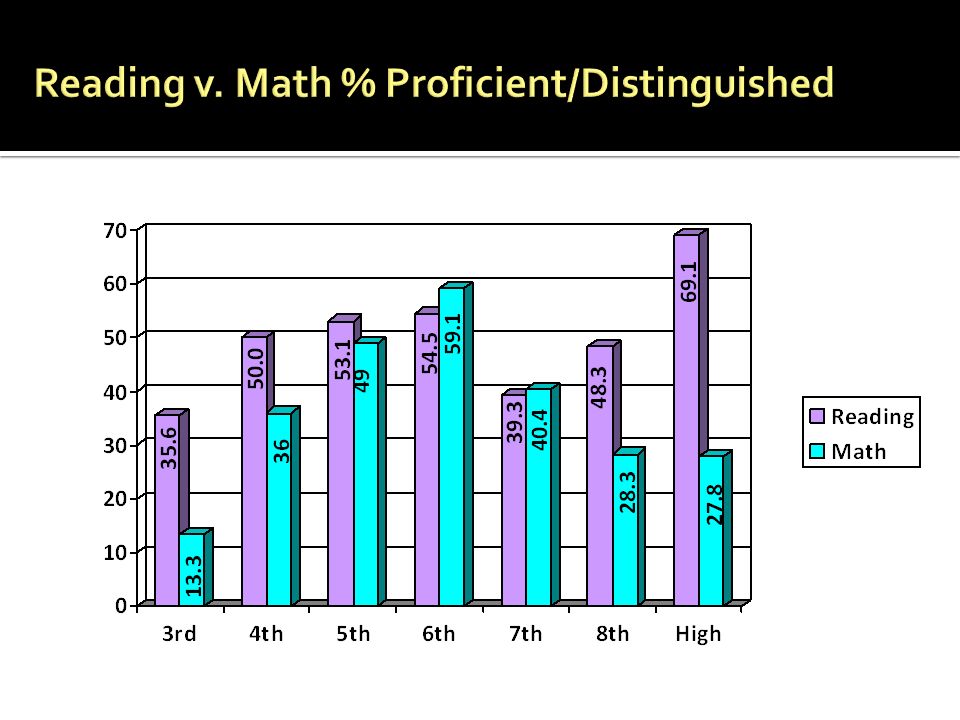
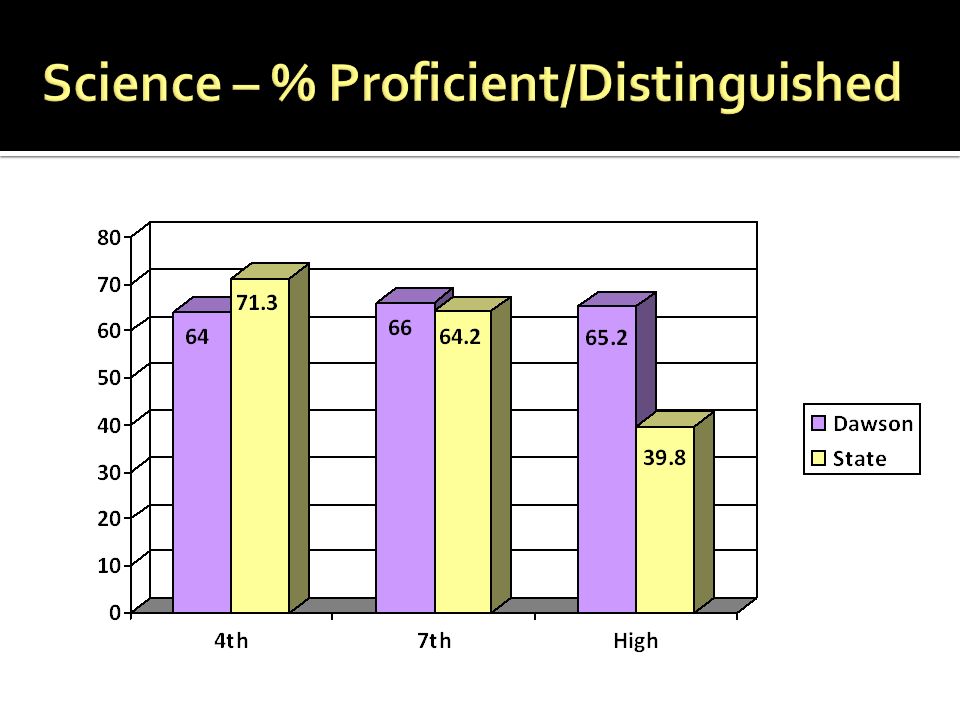
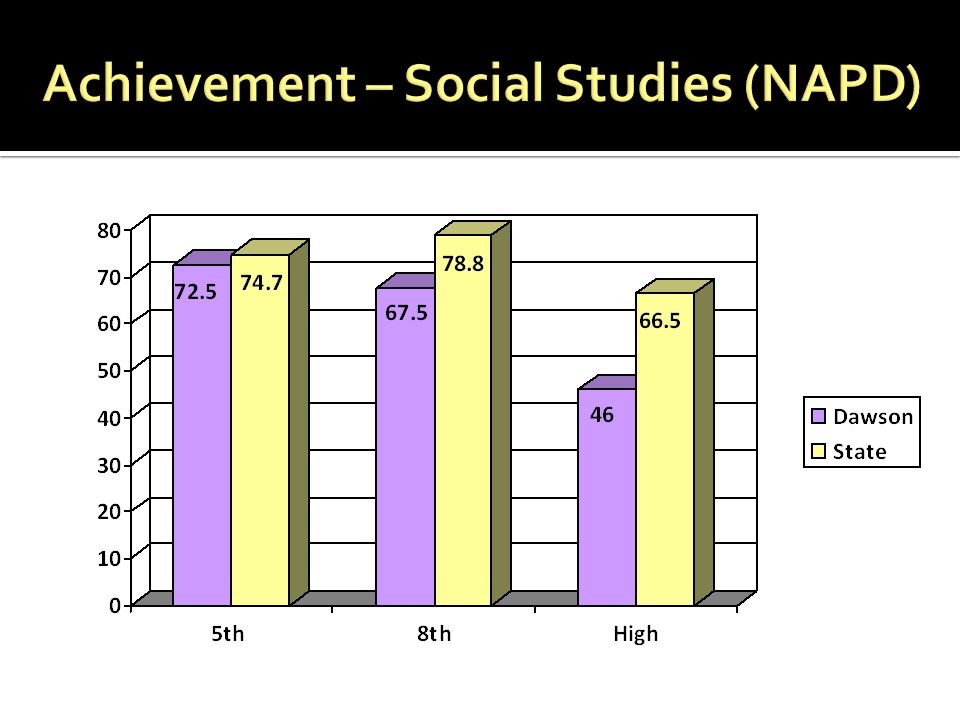
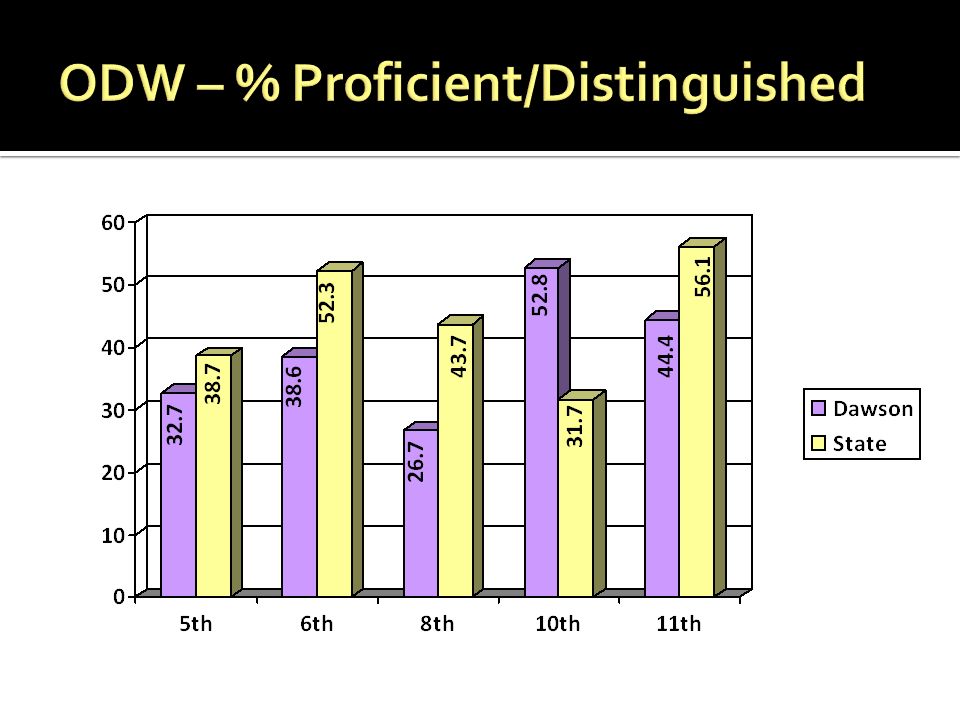
Students are classified in each area as: *Novice *Apprentice *Proficient *Distinguished NAPD Calculation Goal is to raise the number/percentage of students scoring: Proficient or Distinguished

8
Performance Multiplier Weight % Distinguished X1.0 % ProficientX1.0 % ApprenticeX.5 Novice------- 1. Base NAPD Calculation 2. Bonus NAPD Calculation (% Distinguished X.5) -- (% Novice X.5) Base + Bonus = Score Cannot exceed 100 To earn a bonus, % Distinguished must be greater than percent Novice Bonus can only HELP since it can only be a POSITIVE number
 -- (% Novice X.5) Base + Bonus = Score Cannot exceed 100 To earn a bonus, % Distinguished must be greater than percent Novice Bonus can only HELP since it can only be a POSITIVE number.")
9
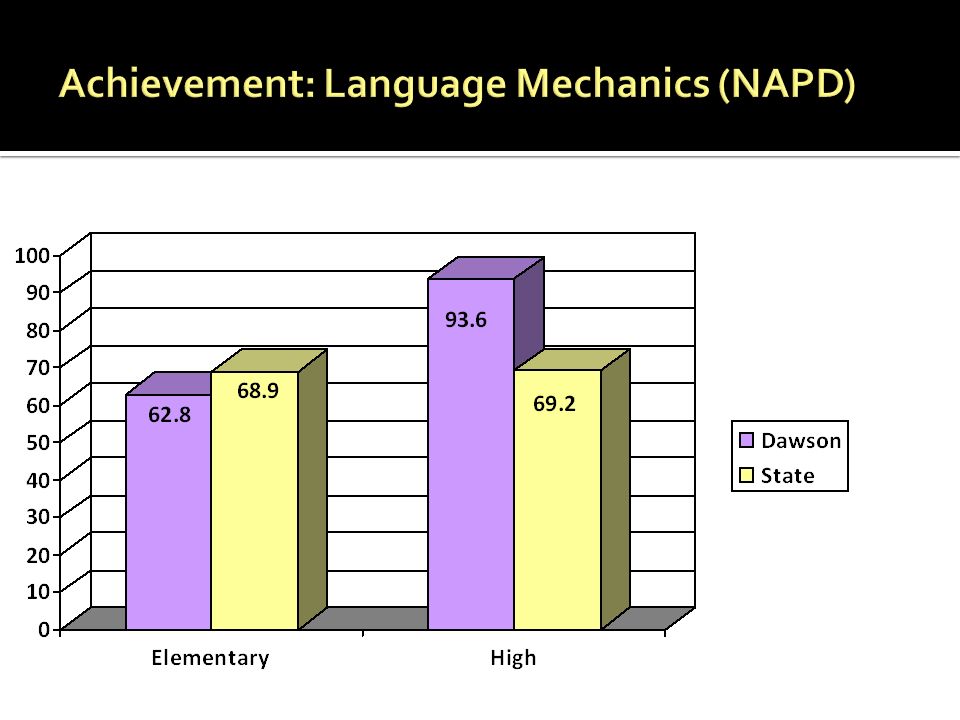
Areas of Assessment: *Math – K-PREP (3 rd, 4 th, 5 th, 6 th ) *Reading – K-PREP (3 rd, 4 th, 5 th, 6 th ) *Science – K-PREP (4 th ) *Social Studies – K-PREP (5 th ) *Language Mechanics – K-PREP (4 th, 6 th ) *On Demand Writing – K-PREP (5 th, 6 th )
 *Reading – K-PREP (3 rd, 4 th, 5 th, 6 th ) *Science – K-PREP (4 th ) *Social Studies – K-PREP (5 th ) *Language Mechanics – K-PREP (4 th, 6 th ) *On Demand Writing – K-PREP (5 th, 6 th )")
10
Areas of Assessment: *Math - K-PREP (7 th, 8 th ) *Reading – K-PREP (7 th, 8 th ) *Science - K-PREP (7 th ) *Social Studies – K-PREP (8 th ) *Writing On-Demand (8 th )
 *Reading – K-PREP (7 th, 8 th ) *Science - K-PREP (7 th ) *Social Studies – K-PREP (8 th ) *Writing On-Demand (8 th )")
11
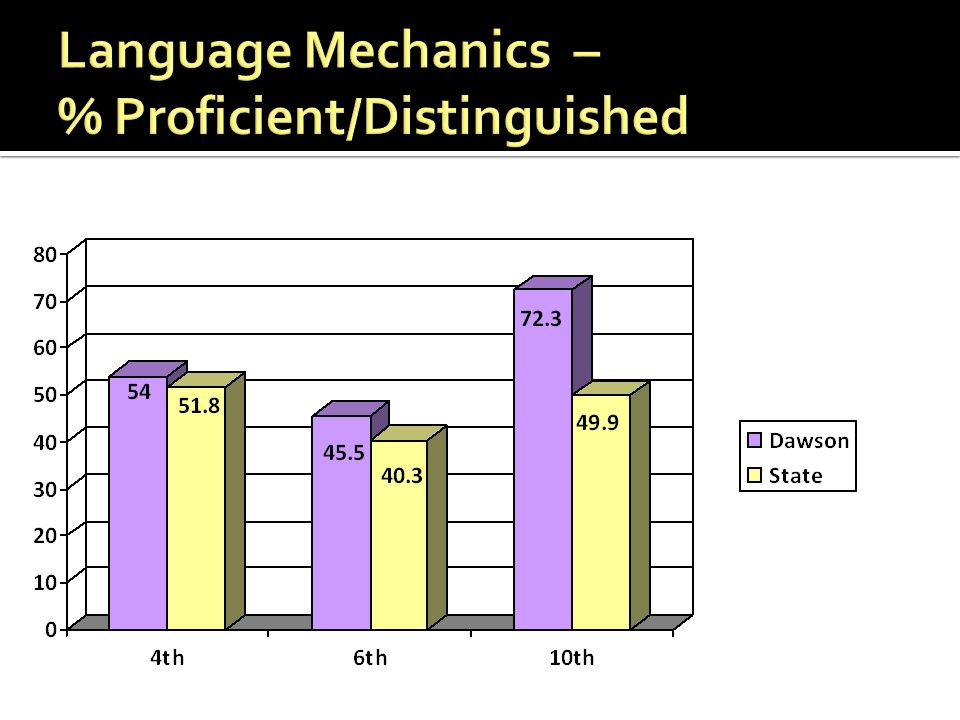
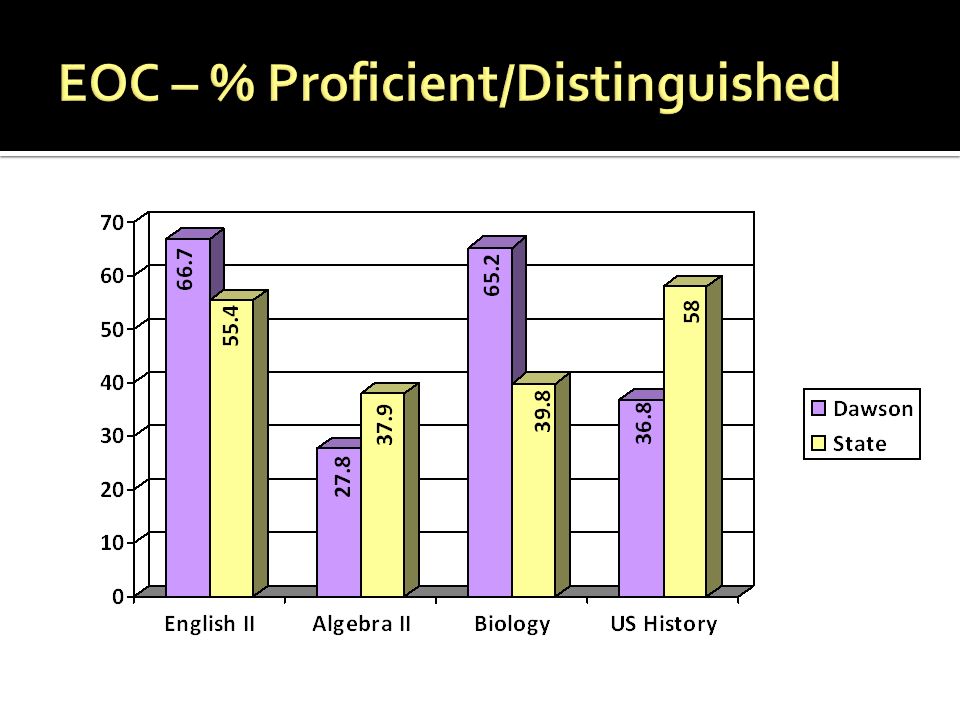
Areas of Assessment: *Language & Mechanics - Plan (10 th ) *Math - Alg II EOC *Reading - Eng II EOC *Science - Bio EOC *Social Studies - US History EOC *Writing On Demand (10 th & 11 th )
 *Math - Alg II EOC *Reading - Eng II EOC *Science - Bio EOC *Social Studies - US History EOC *Writing On Demand (10 th & 11 th )")
28
Not Comparable this year (AFGR to Cohort) Average Freshman Graduation Rate: AFGR provides an estimate of the percentage of high school students who graduate on time. The rate uses aggregate student membership data to estimate the size of an incoming freshman class and aggregate counts of the number of regular diplomas awarded four years later. COHORT: The four-year adjusted cohort graduation rate is the number of students who graduate in four years with a regular high school diploma divided by the number of students who form the adjusted cohort for the graduating class. From the beginning of grade 9, students who are entering that grade for the first time form a cohort that is subsequently “adjusted” by adding any students who transfer into the cohort later during grade 9 and the next three years and subtracting any students who transfer out, emigrate to another country or die during that same period. COHORT will be used from now on.

37
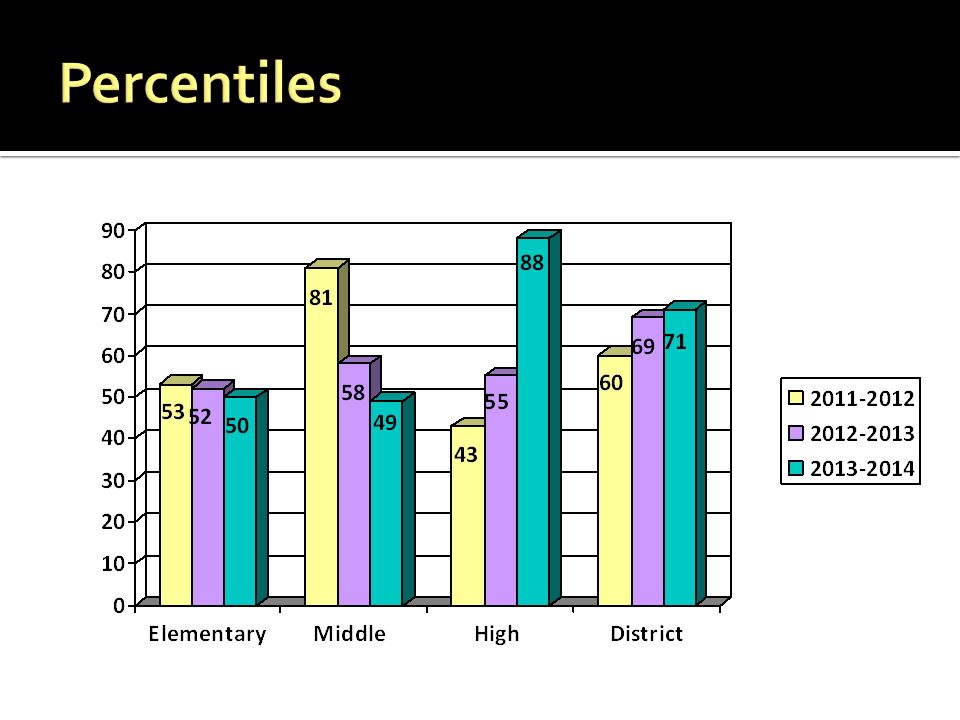
2011 – 2012 Percentile Rank: 60 2012 – 2013 Percentile Rank: 69 2013 – 2014 Percentile Rank: 71 Gain of 2 percentile points

38
SchoolClassificationRewards and Assistance ElementaryNeeds Improvement/ Progressing MiddleNeeds Improvement HighProficient DistrictProficient

39
2013-2014 Academic Year – Dawson Springs Independent Forwarding Student Achievement and Development Every Student, Every Day

40
2013-2014 Academic Year – Dawson Springs Independent

Similar presentations


 Needs Assessment (Why ) Improvement Plan (How) Implement and Monitor.>")


 Office of Assessment and Accountability 10/23/12 1 Assessment and Accountability Update.>")


