Download presentation
Presentation is loading. Please wait.

1
“To Test or Not to Test” December 2008 State Assessment Conference Peter Hendrickson, Everett Assessment Bob Silverman, Puyallup Assessment

2
Puyallup’s Experience

14
District Overview 9 th largest school district in the state 21,938 students 28.8% student diversity 23% students qualify for free/reduced price lunch 33 schools 7 Junior High Schools (6 in 2008) 4 High Schools (3 comprehensive and 1 alternative)
 4 High Schools (3 comprehensive and 1 alternative)")
15
9 th Grade Testing Experience Prior to Spring, 2008 ReadingMathWriting 2006398 students (23%) 291 students (17%) 383 students (22%) 2007719 students (42%) 611 students (36%) 725 students (43%)
 291 students (17%) 383 students (22%) students (42%) 611 students (36%) 725 students (43%)")
16
9 th Grade Testing Experience: Percent Meeting Standard ReadingMathWriting 200685.8%64.7%88.5% 200790.1%63.8%92.4%

17
Our Decision to Expand Consensus of all secondary schools Prior success of our students High Schools request for data more current than 8 th grade results Junior High Schools (teachers and administrators) wanting performance data for 9 th grade students Support of Executive Administration and Board Parent and student support Support of OSPI
 wanting performance data for 9 th grade students Support of Executive Administration and Board Parent and student support Support of OSPI")
18
Our Plan Test all 9 th Grade students in reading and writing With school flexibility for testing students with significant disabilities Test 9 th Grade students in mathematics who were enrolled in at least in geometry

19
Our Process Began the policy conversation with schools in the spring of 2007 Reached consensus as a group in October Developed procedures for communicating with parents in November Mailed letters to parents in December Registered students in December/January

20
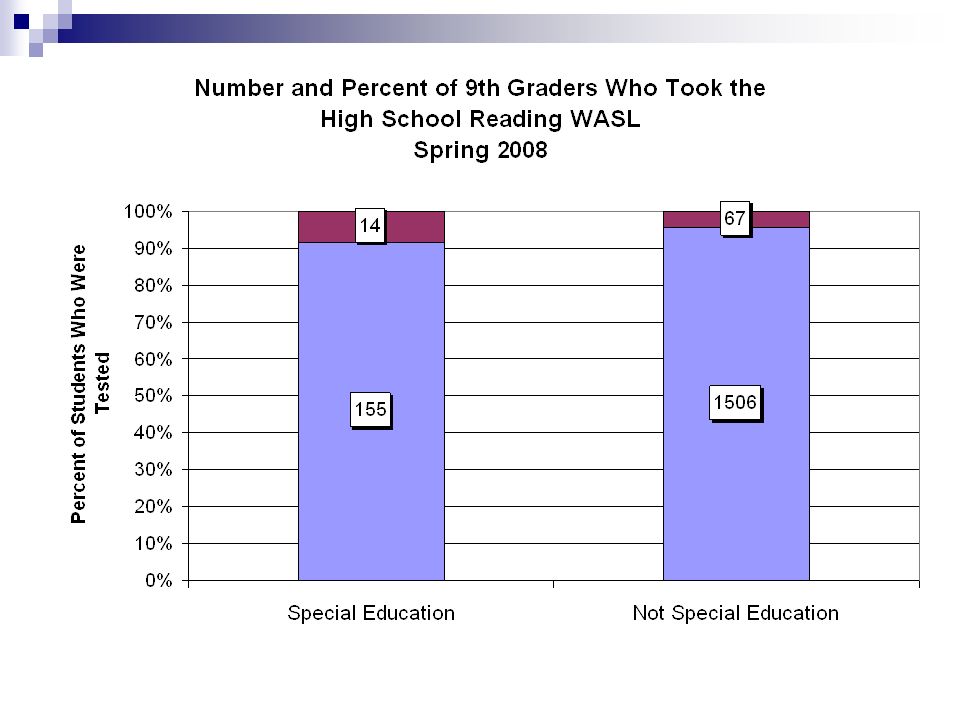
Our Results Percent Tested in Reading:92.7% Percent Tested in Writing:91.2% Percent Tested in Math:60.6%

25
Factors we think contributed to our success in “Writing” Fall district writing assessments since 2002 using state prompts, scoring guides, and anchors Annual professional development for teachers Group scoring opportunity for teachers in target grades In 2007-08, required 9 th grade writing assessment in both the fall and winter Fall: Scored by Teachers on Release Day Winter: Scored by Contractor

27
What we learned about “Math” We had some “rogue” schools Tested all students, regardless of math course being taken The courses students took had a significant impact on student performance

30
What we learned about “Reading” The HS reading test was easier for students than was the 8 th Grade reading test Students at all levels of general “Reading Comprehension” levels were successful on the 9 th Grade Reading WASL

31
Correlation =.691 8 th Grade Reading Scores Related to 9 th Grade Reading Scores, 2007 and 2008 207 Students 73 Students

32
Winter 2008 Degrees of Reading Power: NPR Correlation =.627 Grade 9 Degrees of Reading Power Related to Grade 9 Reading WASL, 2008

33
Issues/Struggles/Concerns Managing the HS assessments in 7 additional schools Logistics of testing Teachers who are proctors, but teach 7/8 graders Teacher loss of planning period Space Negotiating with schools a common approach OSPI reports some data without “previously passed” students How best to use the data in High Schools

34
Will we test 9 th grade students again in 2009? Definitely, yes! Letter sent to parents are included As are our general procedures

Similar presentations


 (Date)>")

 ◦ 4 classes, 80 minutes each per day 1 block each day is for a 40 minute.>")


