Download presentation
Presentation is loading. Please wait.

2
Reference: Figure 6.2. PMBOK® Guide, 5 h Ed Reference: Figure 6.2. PMBOK® Guide, 5 h Ed

3
Plan Schedule Management – The process of establishing the policies, procedures, and documentation for planning, developing, managing, executing, and controlling the project schedule. Define Activities – The process of identifying and documenting the specific actions to be performed to produce the project deliverables. Sequence Activities – The process of identifying and documenting relationships among the project activities.

4
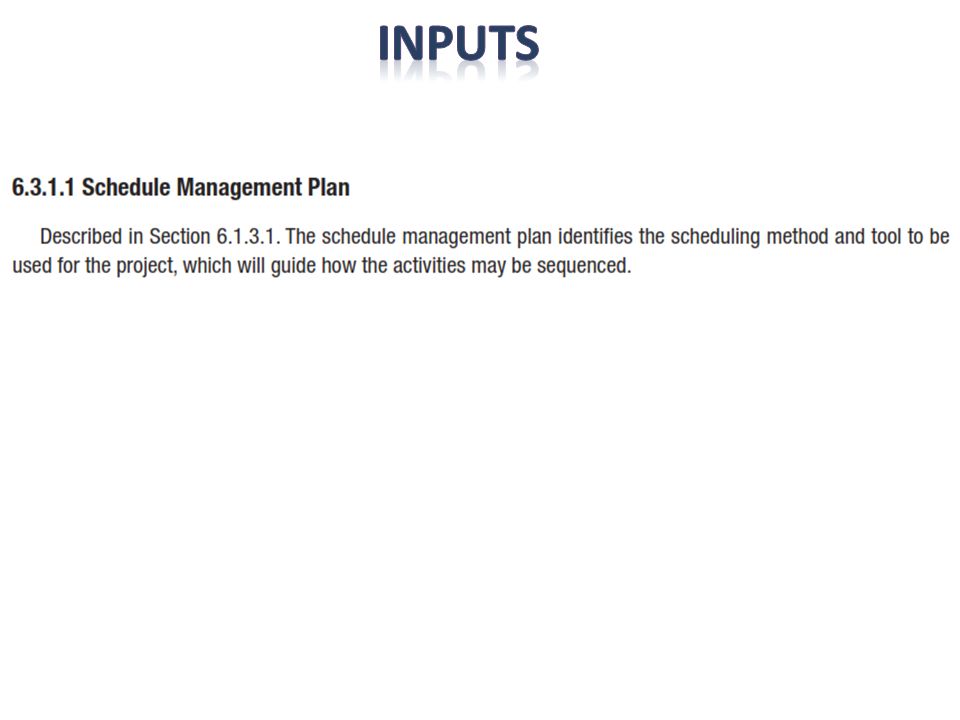
Schedule Management Plan

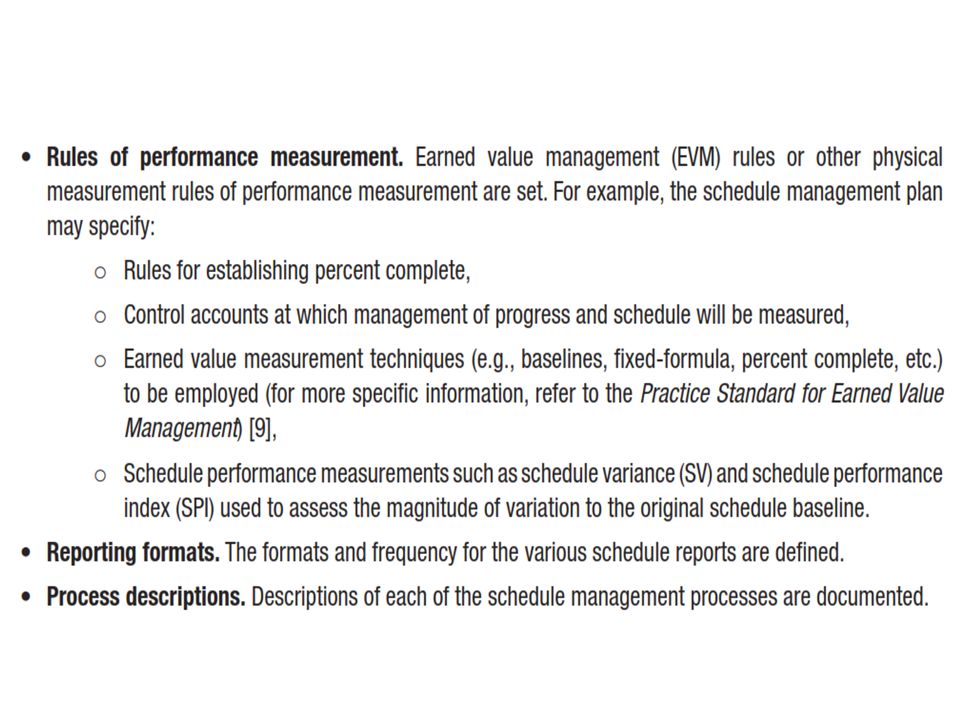
6
6 Activity Lists and Attributes An activity list is a tabulation of activities to be included on a project schedule. The list should include: – The activity name – An activity identifier or number – A brief description of the activity Activity attributes provide more information about each activity, such as predecessors, successors, logical relationships, leads and lags, resource requirements, constraints, imposed dates, and assumptions related to the activity.

7
Milestones A Milestone is a significant event that normally has no duration. It often takes several activities and a lot of work to complete a milestone. Milestones are useful tools for setting schedule goals and monitoring progress. Examples include completion and customer sign- off on key documents and completion of specific products High level milestones are given in project charter

8
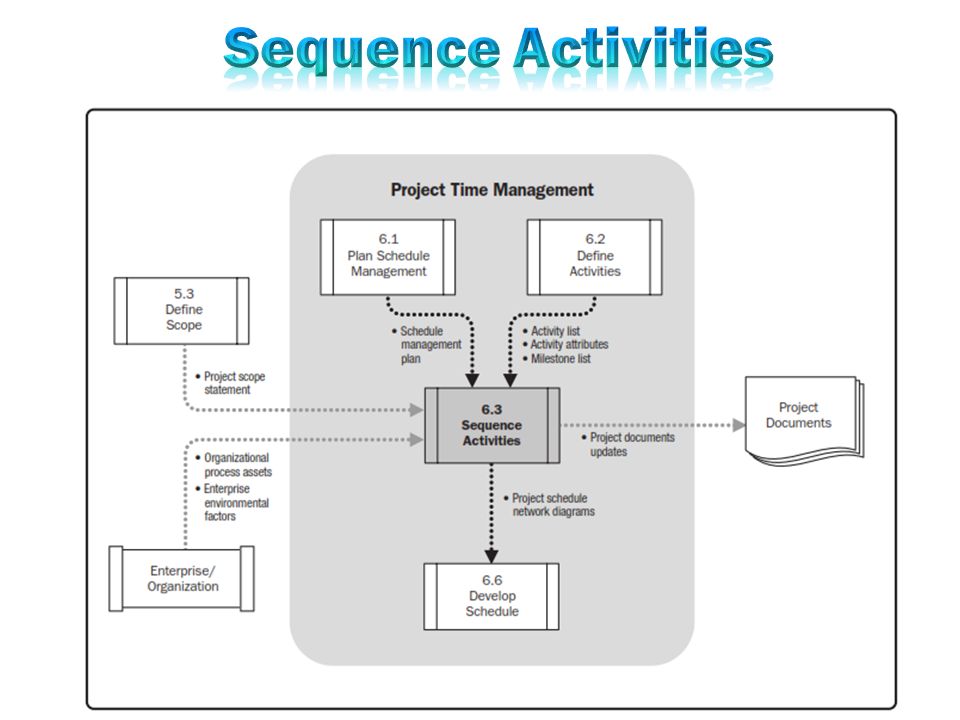
Sequence Activities is the Process of identifying and documenting relationships among the project activities. The key benefit of this process is that the logical sequence of work to obtain the greatest efficiency given all project constraints.

9
After defining project activities, the next step is activity sequencing – Involves reviewing the activity list and attributes, project scope statement, milestone list and approved change requests to determine the relationships between activities A dependency or relationship is the sequencing of project activities or tasks You must determine dependencies in order to use critical path analysis 9

10
1.Project Schedule Network Diagrams 2.Project Document Updates ____________ 1.Precedence Diagramming Method (PDM) 2.Dependency Determination 3.Leads and Lags ____________ Inputs 1 Tools and Techniques 2 Outputs 3 1.Schedule Management Plan 2.Activity List 3.Activity Attributes 4.Milestone List 5.Project Scope Statement 6.Enterprise Environmental Factors 7.Organizational Process Assets ____________
 2.Dependency Determination 3.Leads and Lags ____________ Inputs 1 Tools and Techniques 2 Outputs 3 1.Schedule Management Plan 2.Activity List 3.Activity Attributes 4.Milestone List 5.Project Scope Statement 6.Enterprise Environmental Factors 7.Organizational Process Assets ____________")
19
Precedence Diagramming Method (PDM) Dependency Determination Leads and Lags
 Dependency Determination Leads and Lags")
21
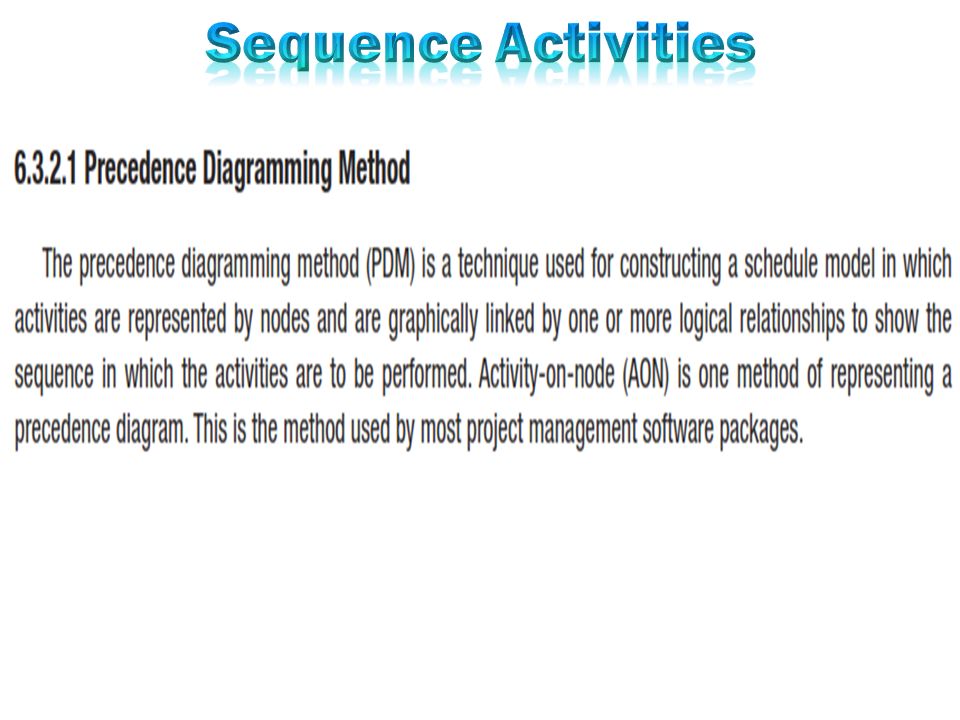
Precedence Diagramming Method (PDM) More popular than ADM method and used by project management software Activities are represented by boxes Arrows show relationships between activities Better at showing different types of dependencies 21
 More popular than ADM method and used by project management software Activities are represented by boxes Arrows show relationships between activities Better at showing different types of dependencies 21")
22
Arrow Diagramming Method (ADM) Also called activity-on-arrow (AOA) network diagrams Activities are represented by arrows Nodes or circles are the starting and ending points of activities Can only show finish-to-start dependencies Can omit activities that have no dependencies 22 Project Time Management
 Also called activity-on-arrow (AOA) network diagrams Activities are represented by arrows Nodes or circles are the starting and ending points of activities Can only show finish-to-start dependencies Can omit activities that have no dependencies 22 Project Time Management")
23
A Comparison of AON and AOA Network Conventions Activity onActivityActivity on Node (AON)MeaningArrow (AOA) B and C cannot begin until A is completed. D cannot begin until both B and C are completed. A dummy activity is again introduced in AOA. A C DB AB C D Dummy activity

25
Finish-to-Start – Activity A must finish before Activity B can start AB Start-to-Start – Activity A must start before Activity B can start A B

26
Finish-to-Finish – Activity A must finish before Activity B can finish A B Start-to-Finish – Activity A must start before Activity B can finish A B

28
AON Example ActivityDescription Immediate Predecessors A Build internal components — B Modify roof and floor — C Construct collection stack A D Pour concrete and install frame A, B E Build high-temperature burner C F Install pollution control system C G Install air pollution device D, E H Inspect and test F, G Table 3.1

29
29 Activities are represented by boxes. Arrows show relationships between activities. Better at showing different types of dependencies.

30
AON Network A Start B Start Activity Activity A (Build Internal Components) Activity B (Modify Roof and Floor)
 Activity B (Modify Roof and Floor)")
31
C D A Start B Activity A Precedes Activity C Activities A and B Precede Activity D

32
G E F H C A Start DB Arrows Show Precedence Relationships

34
Three Types of Dependencies Mandatory dependencies: inherent in the nature of the work being performed on a project, sometimes referred to as hard logic Discretionary dependencies: defined by the project team; sometimes referred to as soft logic and should be used with care since they may limit later scheduling options – Don’t start detailed design work until users sign-off on all the analysis – good practice but can delay project External dependencies: involve relationships between project and non-project activities – Delivery of new hardware; if delayed can impact project schedule 34

35
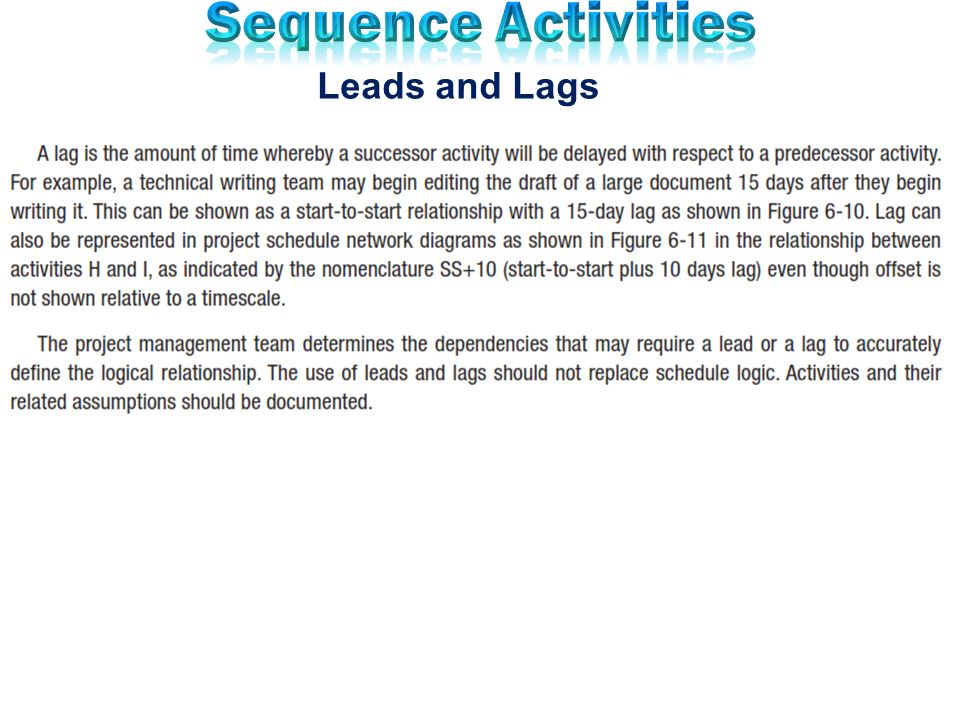
Leads and Lags

41
Project Schedule Network Diagram Project Documents Updates Activity List Activity Attributes Milestone List Risk Register Enterprise Environmental Factors Organizational Process Assets

43
Network Diagrams Network diagrams are the preferred technique for showing activity sequencing A network diagram is a schematic display of the logical relationships among, or sequencing of, project activities Two main formats are the arrow and precedence diagramming methods 43

44
Steps in Network Diagraming Steps in Network Diagraming 1.Specify the individual activities. 2.Determine the sequence of those activities. 3.Draw a network diagram. 4.Estimate the completion time for each activity. 5.Identify the critical path (longest path through the network) Network Diagrams
 Network Diagrams.")
45
Develop Network Diagram? ActivityDescriptionTime (weeks) ABuild internal components2 BModify roof and floor3 CConstruct structure2 DPour concrete and install frame4 EBuild high-temperature burner4 FInstall pollution control system 3 GInstall air pollution device5 HInspect and test2 Total Time (weeks)25
 ABuild internal components2 BModify roof and floor3 CConstruct structure2 DPour concrete and install frame4 EBuild high-temperature burner4 FInstall pollution control system 3 GInstall air pollution device5 HInspect and test2 Total Time (weeks)25.")
46
ActivityDescription Immediate Predecessors A Build internal components — B Modify roof and floor — C Construct collection stack A D Pour concrete and install frame A, B E Build high-temperature burner C F Install pollution control system C G Install air pollution device D, E H Inspect and test F, G

47
6.3.3.1 Project Schedule Network Diagram

48
Assignment EGEG

51
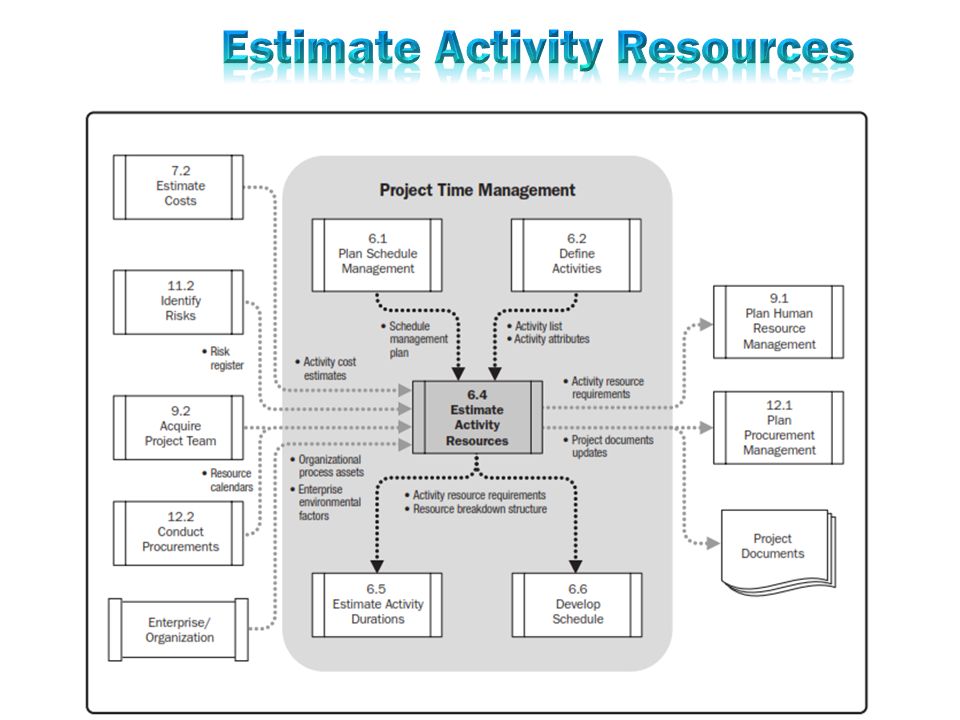
Estimate Activity resources is the Process of estimating the type and quantities of material, human resources, equipment, or supplies required to perform each activity. The key benefit of this process is that it identifies the type, quantity, and characteristics of resources required to complete the activity which allows more accurate cost and duration estimates.

52
Estimating – The process of forecasting or approximating the time and cost of completing project deliverables. – The task of balancing expectations of stakeholders and need for control while the project is implemented. Types of Estimates – Top-down (macro) estimates: analogy, group consensus, or mathematical relationships – Bottom-up (micro) estimates: estimates of elements of the work breakdown structure
 estimates: analogy, group consensus, or mathematical relationships – Bottom-up (micro) estimates: estimates of elements of the work breakdown structure.")
53
Why Estimating Time and Cost Are Important To support good decisions. To schedule work. To determine how long the project should take and its cost. To determine whether the project is worth doing. To develop cash flow needs. To determine how well the project is progressing. To develop time-phased budgets and establish the project baseline.

54
Factors Influencing the Quality of Estimates Quality of Estimates Project Duration People Project Structure and Organization Padding Estimates Organization Culture Other (Nonproject) Factors Planning Level
 Factors Planning Level")
55
Estimating Guidelines for Times, Costs and Resources 1.Have people familiar with the tasks make the estimate. 2.Use several people to make estimates. 3.Use consistent units in estimating task times. 4.Don’t make allowances for contingencies. 5.Adding a risk assessment helps avoid surprises to stakeholders. Before estimating activity durations, you must have a good idea of the quantity and type of resources that will be assigned to each activity Consider important issues in estimating resources How difficult will it be to do specific activities on this project? What is the organization’s history in doing similar activities? Are the required resources available or need to be acquired?

56
Top-Down versus Bottom-Up Estimating Top-Down Estimates Top-Down Estimates – Are usually are derived from someone who uses experience and/or information to determine the project duration and total cost. – Are made by top managers who have little knowledge of the processes used to complete the project. Bottom-Up Approach Bottom-Up Approach – Can serve as a check on cost elements in the WBS by rolling up the work packages and associated cost accounts to major deliverables at the work package level.

57
1.Activity Resource Requirements 2.Resource Breakdown Structure 3.Project Document Updates ____________ 1.Expert Judgment 2.Alternatives Analysis 3.Published Estimating Data 4.Bottom-up Estimating 5.Project Management Software ____________ 1.Schedule Management Plan 2.Activity List 3.Activity Attributes 4.Resource Calendars 5.Risk register 6.Activity Cost estimates 7.Enterprise Environmental Factors 8.Organizational Process Assets Inputs 1 Tools and Techniques 2 Outputs 3

59
Schedule Management Plan Activity List Activity Attributes Resource Calendars Risk Register Activity Cost Estimates Enterprise Environmental Factors Organizational Process Assets

66
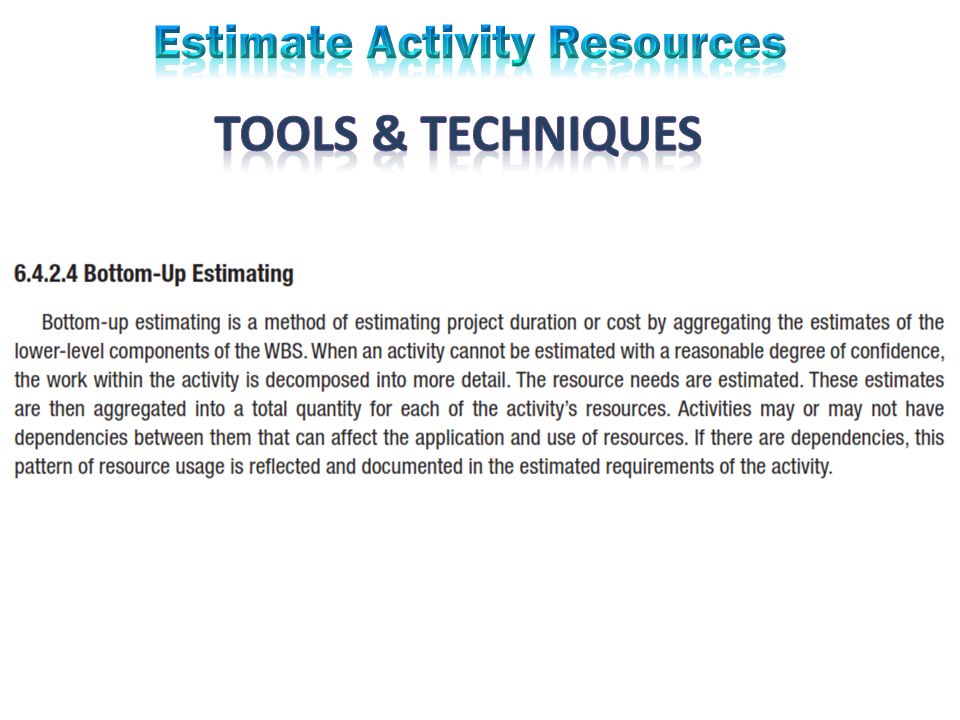
Expert Judgment Alternatives Analysis Published Estimating Data Bottom-up Estimating Project Management Software

72
Activity Resource Requirements Resource Breakdown Structure Project Documents Updates

77
1.Activity Duration Estimates 2.Project Document Updates ____________ 1.Expert Judgment 2.Analogous Estimating 3.Parametric Estimating 4.Three-Point Estimates 5.Group Decision-Making Techniques 6.Reserve Analysis ____________ 1.Schedule Management Plan 2.Activity Lis 3.Activity Attributes 4.Activity Resource Requirements 5.Resource Calendars 6.Project Scope Statement 7.Risk Register 8.Resource Breakdown structure 9.Enterprise Environmental Factors 10.Organizational Process Assets ____________ Inputs 1 Tools and Techniques 2 Outputs 3

80
6.5.1.1 Schedule Management Plan 6.5.1.2 Activity List 6.5.1.3 Activity Attributes 6.5.1.4 Activity Resource Requirements 6.5.1.5 Resource Calendars 6.5.1.6 Project Scope Statement 6.5.1.7 Risk Register 6.5.1.8 Resource Breakdown Structure 6.5.1.9 Enterprise Environmental Factors 6.5.1.10 Organizational Process Assets

81
6.5.1.1 Schedule Management Plan

82
Activity List

83
Activity Attributes

84
Activity Resource Requirements

85
Resource Calendars

86
Project Scope Statement

87
Risk Register

88
Resource Breakdown Structure

89
Enterprise Environmental Factors

90
Organizational Process Assets

91
Expert Judgment Analogous Estimating Parametric Estimating Three-Point Estimates Group Decision-Making Techniques Reserve Analysis

92
Expert Judgment

93
Analogous Estimating

94
Parametric Estimating

95
Three-Point Estimates

96
Most likely. The duration of the schedule activity, given the resources likely to be assigned, their productivity, realistic expectations of availability for the schedule activity, dependencies on other participants, and interruptions. Optimistic. The activity duration is based on a best-case scenario of what is described in the most likely estimate. Pessimistic. The activity duration is based on a worst-case scenario of what is described in the most likely estimate. Three-Point Estimates

98
Group Decision-Making Techniques

99
Reserve Analysis

100
Activity Duration Estimates Project Documents Updates

101
Activity duration estimates are quantitative assessments of the likely number of work periods that will be required to complete a schedule activity. Activity duration estimates include some indication of the range of possible results. For example: 2 weeks ± 2 days to indicate that the schedule activity will take at least eight days and no more than twelve (assuming a five-day workweek). 15 percent probability of exceeding three weeks to indicate a high probability—85 percent—that the schedule activity will take three weeks or less. Activity Duration Estimates
. 15 percent probability of exceeding three weeks to indicate a high probability—85 percent—that the schedule activity will take three weeks or less. Activity Duration Estimates.")
102
Project Documents Updates

103
Estimate Activity Durations is the Process of estimating the number of work periods needed to complete individual activities with estimated resources. The key benefit of this process is that it provides the amount of time each activity will take to complete, which is a major input into the Develop Schedule process.

104
5–104 Types of Costs Direct Costs Direct Costs – Costs that are clearly chargeable to a specific work package. Labor, materials, equipment, and other Direct (Project) Overhead Costs Direct (Project) Overhead Costs – Costs incurred that are directly tied to an identifiable project deliverable or work package. Salary, rents, supplies, specialized machinery General and Administrative Overhead Costs General and Administrative Overhead Costs – Organization costs indirectly linked to a specific package that are apportioned to the project
 Overhead Costs Direct (Project) Overhead Costs – Costs incurred that are directly tied to an identifiable project deliverable or work package. Salary, rents, supplies, specialized machinery General and Administrative Overhead Costs General and Administrative Overhead Costs – Organization costs indirectly linked to a specific package that are apportioned to the project.")
Similar presentations


![~ pertemuan 6 ~ Oleh: Ir. Abdul Hayat, MTI 03-Apr-2009 [Abdul Hayat, Project Time Management, Semester Genap 2008/2009] 1 PROJECT TIME MANAGEMENT.](/24/7407393/big_thumb.jpg "~ pertemuan 6 ~ Oleh: Ir. Abdul Hayat, MTI 03-Apr-2009 [Abdul Hayat, Project Time Management, Semester Genap 2008/2009] 1 PROJECT TIME MANAGEMENT.>")