Download presentation
Presentation is loading. Please wait.

1
Climate Change Scenarios for Brook Trout Persistence: Issues of Scale Mark Hudy October 2010 US Forest Service Fish and Aquatic Ecology Unit, Harrisonburg, VA

2
USFS Fish and Aquatic Ecology UnitIntroduction

3
Brook Trout Range 29 % of brook trout subwatersheds have been extirpated (EBTJV 2005) No known population losses because of climate change
 No known population losses because of climate change")
4
Case Study: Virginia Brook Trout Habitat Extirpated Intact

5
Under various climate change scenarios, brook trout are predicted to be extirpated from parts of the historic range ( i.e. Virginia) Flebbe et al. 2006. Spatial Modeling to Project Southern Appalachian Trout Distribution in a Warmer Climate. TAFS Clark et al. 2001. Predicting Climate Change Effects on Appalachian Trout: Combining GIS and Individual –Based Modeling. Ecological Applications. Meisner. 1990. Effect of Climatic Warming on the southern margins of the Native Brook Trout. CJAS Brook Trout Habitat Extirpated Intact
 Flebbe et al Spatial Modeling to Project Southern Appalachian Trout Distribution in a Warmer Climate. TAFS Clark et al Predicting Climate Change Effects on Appalachian Trout: Combining GIS and Individual –Based Modeling. Ecological Applications. Meisner Effect of Climatic Warming on the southern margins of the Native Brook Trout. CJAS Brook Trout Habitat Extirpated Intact.")
6
Secondary Data Used in Regional Models Air Temperature: – Mean annual maximum air temperature (PRISM; 800 m grid) – Air Temperature from Elevation or Elevation/Latitude models – Models from local weather stations ( i.e. airports, NOAA) Water Temperature: – Usually no direct measurements – Assume a steady relationship between air and water temperatures (i.e. 1°C air temp rise = 0.8°C water temp rise) Focus on elevation and latitude as driving metrics in temperature relationships: ∆188m elevation 1°C air temp rise = 1°C water temp rise (Flebbe et al. 2006)
 Water Temperature: – Usually no direct measurements – Assume a steady relationship between air and water temperatures (i.e. 1°C air temp rise = 0.8°C water temp rise) Focus on elevation and latitude as driving metrics in temperature relationships: ∆188m elevation 1°C air temp rise = 1°C water temp rise (Flebbe et al. 2006).")
9
USFS Fish and Aquatic Ecology UnitObjectives

10
OBJECTIVES 1.Directly measure variability between air and water temperature during critical summer period (July 1 – September 30). 2.Develop a classification system for managers using sensitivity and vulnerability metrics

11
Vulnerability Sensitivity

12
Sensitivity Metric The change in the daily maximum water temperature (DMAXW) from a 1°C increase in the daily maximum air temperature (DMAXA)
 from a 1°C increase in the daily maximum air temperature (DMAXA)")
13
Vulnerability Metrics Average Standardized Score (x-mean)/SD 1.Duration (consecutive days above 21°C) 2.Proportion (frequency of days above 21°C) 3.Magnitude (average DMAXW of all DMAXW days over 21 °C)
/SD 1.Duration (consecutive days above 21°C) 2.Proportion (frequency of days above 21°C) 3.Magnitude (average DMAXW of all DMAXW days over 21 °C)")
14
USFS Fish and Aquatic Ecology Unit Study Area

15
Patches of Brook Trout (n = 2,329)
")
16
USFS Fish and Aquatic Ecology UnitMethods

17
Sample Units

18
1. NHD + catchments 2. Classify catchments by brook trout status http://www.fisheyeguyphotography.com/pics/trout- small/brook-trout-photo-77.jpg Dam

19
http://www.fisheyeguyphotography.com/pics/trout- small/brook-trout-photo-49.jpg 3. Dissolve contiguous brook trout catchments into sample units (“Patches”) 4. Directly measure paired air and water temperature at patch centroid and pour-points
 4. Directly measure paired air and water temperature at patch centroid and pour-points.")
20
Thermographs Temperature data is being collected at 30 minute intervals with focus on the critical summer periods (July-September 30) This talk focuses on daily maximum water (DMAXW) and daily maximum air (DMAXA) Onset HOBO Water Temp Pro v2 Operation Range: -20 to 70°C Accuracy: 0.2°C over 0° to 50°C Resolution: 0.02°C at 25°C
 This talk focuses on daily maximum water (DMAXW) and daily maximum air (DMAXA) Onset HOBO Water Temp Pro v2 Operation Range: -20 to 70°C Accuracy: 0.2°C over 0° to 50°C Resolution: 0.02°C at 25°C")
21
USFS Fish and Aquatic Ecology UnitResults

22
Sensitivity (Secondary Data)
")
23
Sensitivity (n = 77 ) DMAXW Mean ∆ 0.38
 DMAXW Mean ∆ 0.38")
24
Vulnerability Duration: Mean 11.75 (SD =17.1) range 0 to 56 days Proportion: Mean 23% (SD = 29.0 %) range 0.0 to 91.0% Magnitude: Mean 0.76 (SD = 0.99) range 0.00 to 3.80
 range 0 to 56 days Proportion: Mean 23% (SD = 29.0 %) range 0.0 to 91.0% Magnitude: Mean 0.76 (SD = 0.99) range 0.00 to 3.80")
25
Vulnerability Sensitivity

26
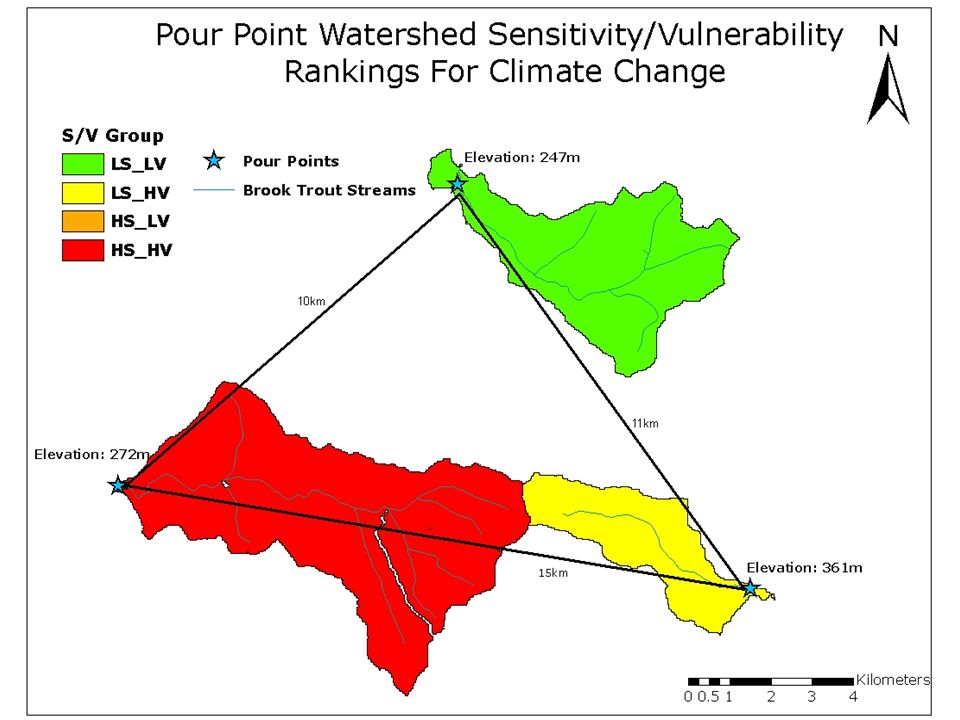
Sensitivity/Vulnerability Habitat Classification 51.9% 29.9% 10.4% 7.8%

27
USFS Fish and Aquatic Ecology UnitDiscussion

30
Can Managers Risk a Type I or Type II Error Investment of $100’s k in restoration ? Selection of conservation populations (genetic integrity)
.")
31
Climate change Scenarios

32
Acknowledgements VA Department of Game and Inland Fisheries for HOBO funding US Forest Service Northern and Southern Research Station James Madison University, Department of Biology Virginia Tech USFWS

34
USFS Fish and Aquatic Ecology Unit Candidate Model Metrics??

35
Solar Gain Metric –Latitude –Longitude –Elevation –Aspect –% Canopy Cover –Hill Shading http://www.tnaqua.org/newsroom/HighRes/BrookTrout_exhibit.jpg

36
Predictive Scale Appropriate Models: CART?? Solar gain – Hill shading – Aspect – Lat/long – Canopy cover Elevation Patch area groundwater ???????

37
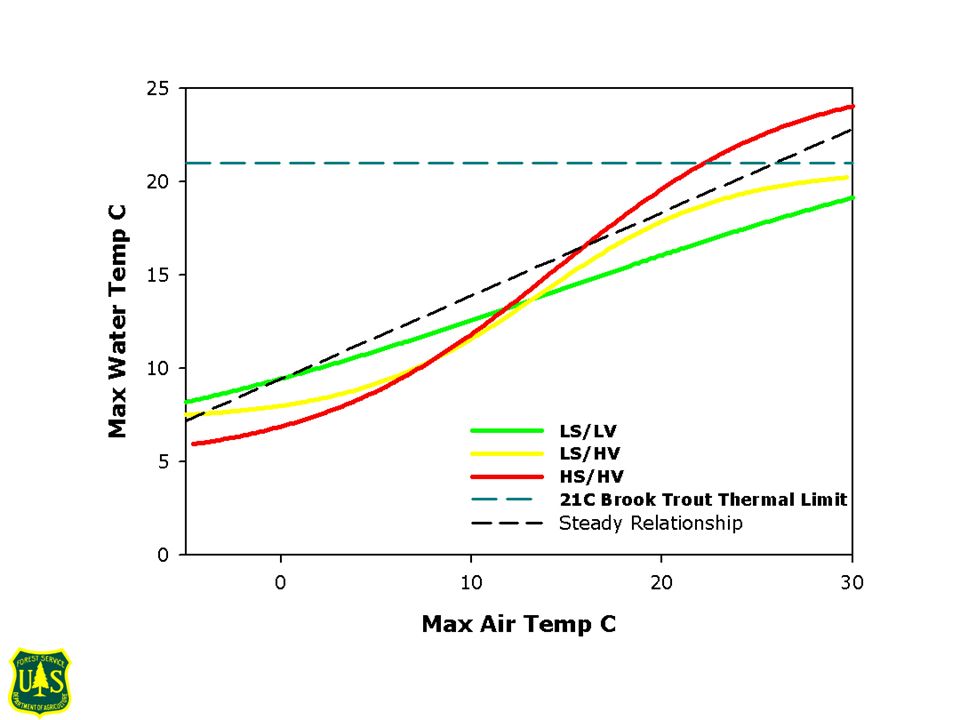
Sensitivity Metric The change in the daily maximum water temperature (DMAXW) from a 1°C increase in the daily maximum air temperature (DMAXA) High Sensitivity (HS) = patch median > 0.38°C Low Sensitivity (LS) = patch median < 0.38°C
 from a 1°C increase in the daily maximum air temperature (DMAXA) High Sensitivity (HS) = patch median > 0.38°C Low Sensitivity (LS) = patch median < 0.38°C")
38
Vulnerability Metrics Average Standardized Score (x-mean)/SD 1.Duration (consecutive days above 21°C) 2.Proportion (frequency of days above 21°C) 3.Magnitude (average DMAXW of all DMAXW days over 21 °C) High Vulnerability (HS) = any value of DMAXW over 21°C Low Vulnerability (LS) = all values of DMAXW under 21°C
/SD 1.Duration (consecutive days above 21°C) 2.Proportion (frequency of days above 21°C) 3.Magnitude (average DMAXW of all DMAXW days over 21 °C) High Vulnerability (HS) = any value of DMAXW over 21°C Low Vulnerability (LS) = all values of DMAXW under 21°C")
Similar presentations