Download presentation
Presentation is loading. Please wait.

1
How to design arrays with Next generation sequencing (NGS) data Lecture 2 Christopher Wheat
 data Lecture 2 Christopher Wheat")
2
Outline Transcriptome sequencing Assembly Assessing assembly Annotation Calling SNPs Designing probes Making decisions about experimental design 2

3
48k contigs Vera and Wheat et al. 2008 ≈10,000 genes in triplicate Gene annotation

4
Getting the genes Cheapest method is to directly sequence them Sequence the transcritptome Challenges Getting right tissue, timing, induction, etc. Getting the population variation (SNPs, indels, etc.) Getting the high quality RNA Choosing a sequencing method Assembling the data and assessing it Annotating the data 4
 Getting the high quality RNA Choosing a sequencing method Assembling the data and assessing it Annotating the data 4.")
5
Pool? Yes! Normalize? Maybe …. 5

6
8 day old aerial tissue, A. thaliana seedlings Run 1 touched 17,449 gene models (60% of genes) Run 2 only touched 10% more Microarray studies indicate 55-67% of genes expressed in this tissue They estimate they have 90% of transcriptome in the tissue Weber et al. 2007
 Run 2 only touched 10% more Microarray studies indicate 55-67% of genes expressed in this tissue They estimate they have 90% of transcriptome in the tissue Weber et al")
7
Roche 454 Fundamental tradeoffs in read: length vs. depth vs. cost Illumina Length: 400 vs. 2 x 100 bp Depth: 1.2 E6 vs. 300 E6 reads Costs: 10,000 Euros vs. 2500 Euros long but shallow short but deep vs.

8
Roche 454 Stats per run: 350 - 450 bp 1.2 E6 reads 500 MBp 0.5 days 10,000 euro?

9
Flow diagram TCAGCGTAAGG GGGG

10
Huse et al. 2007

11
Illumina Illumina, Inc.

12
Illumina Stats: 2 x 100 bp 300-500 E6 reads 60-200 GBp 9.5 days 3,000 euros? Illumina, Inc.

13
Dephasing limits read length No homopolymer runs issues due to difference in sequence by synthesis method Per read error rate current estimate is very low Correction methods quality scores and bioinformatics http://seq.molbiol.ruhttp://seq.molbiol.ru/

14
Which to use? Illumina PE because there is so much more data generated per euro, for good transcriptome coverage and thus assembly of even low expressed genes or rare isoforms (do your own price comparisons) 14
 14.")
15
Challenge: Bioinformatics Assembly Transcriptome (all the above issues) SNPs, indels, CNV, repeated elements, error Fragmented assembly is the norm Alternative splicing Software Trinity, Oasis, TransAbyss, Seqman,CAP3,Mira2, Newbler, CLC, etc. Settings Many methods, few studies comparing their performance But see Kumar and Blaxter, and Trinity paper. Computational power (beyond HD space): CPU vs RAM: tends to be RAM intensive,
: CPU vs RAM: tends to be RAM intensive,.")
16
Learn bioinformatics, hire a bioinformatician, buy expensive software …. All comes down to time and money …. But there is also no “perfect” way to do something, as each species appears to be a bit different, so comparing different methods is the best route CLC is a very nice, accessible commercial package, but like all things, it requires a fast computer. 16

17
Blast against what? Important to determine a genomic reference species Predicted gene models for comparison Need species with predicted gene set ideally < 100 million years divergent Many genes should be shared Even divergent species are useful for assessing assembly run method X parameters Compare results 17

18
Predicted genes: D. melanogaster = 13,379 B. mori = 18,510 Estimated coverage: 70% D. mel estimate 50% B. mori estimate But how much of each gene does each contig assemble? How much fragmentation?

19
But what do these numbers mean? 45,000 contigs had blast hit to 9000 gene models in another species What are these gene models? Are isoforms included? Filtering the predicted gene set to remove isoforms and recent duplicates helps greatly RBB90 dataset is useful. 19 Cd-hit: a fast program for clustering and comparing large sets of protein or nucleotide sequences

20
Potential Blast bias source20 Wheat, C. W. (2012) SNP Discovery in Non-model Organisms Using 454 Next Generation Sequencing.
 SNP Discovery in Non-model Organisms Using 454 Next Generation Sequencing..")
21
Metabolic Map Comparison Bombyx mori with WGS M. cinxia with 454 seq.

22
Upper estimate of 70% = 13,142 genes Wheat 2008

23
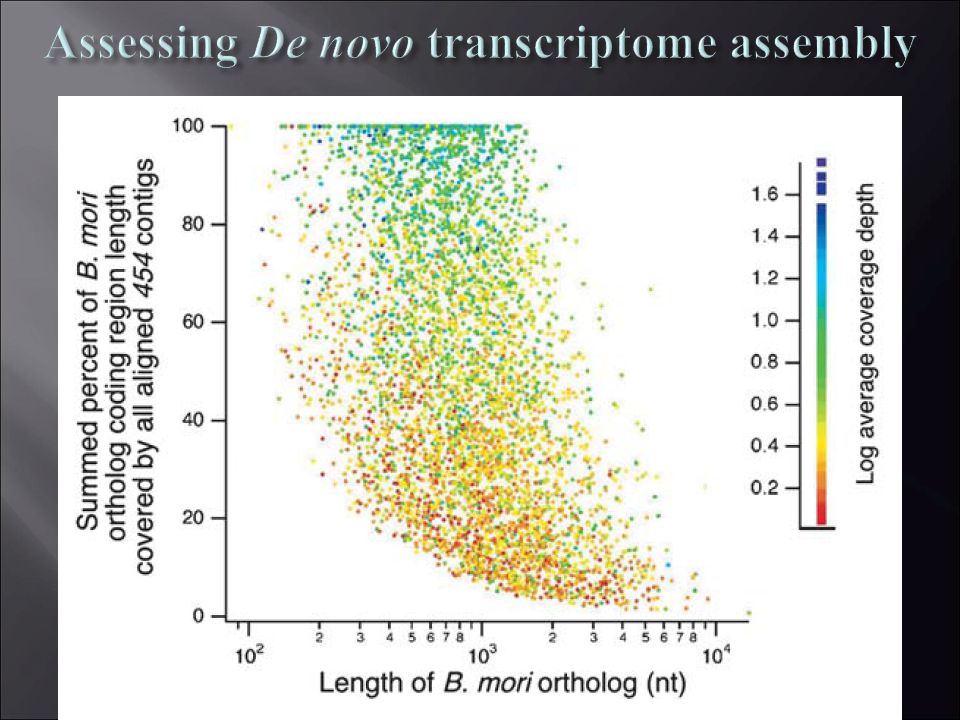
Assessing De novo transcriptome assembly Vera & Wheat et al. 2008 Mol. Ecol. Nearest WGS: Focal species 454: > 1 = 1 < 1

25
Hornett & Wheat et al. 2012

26
Relative ortholog coverage

27
Ex. 6 species assemblies with blast result insights 454 EST libraries 22 genes assessed for sequence coverage

28
Alternative splicing > 80% in humans > 40 % in fruit flies Most assemblers Designed for genomic data Don’t know how to handle splicing But Trinity can!

29
Transcriptome assembly: alternative splicing example Vera and Wheat et al. 2008 What effects will this have on a microarray?

30
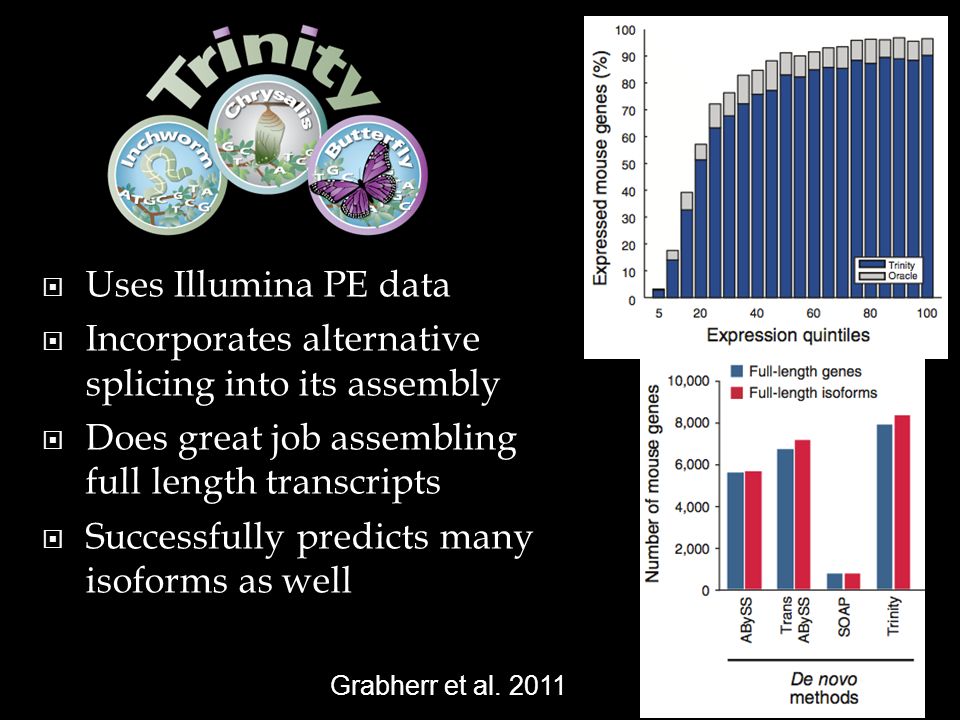
Uses Illumina PE data Incorporates alternative splicing into its assembly Does great job assembling full length transcripts Successfully predicts many isoforms as well 30 Grabherr et al. 2011
31
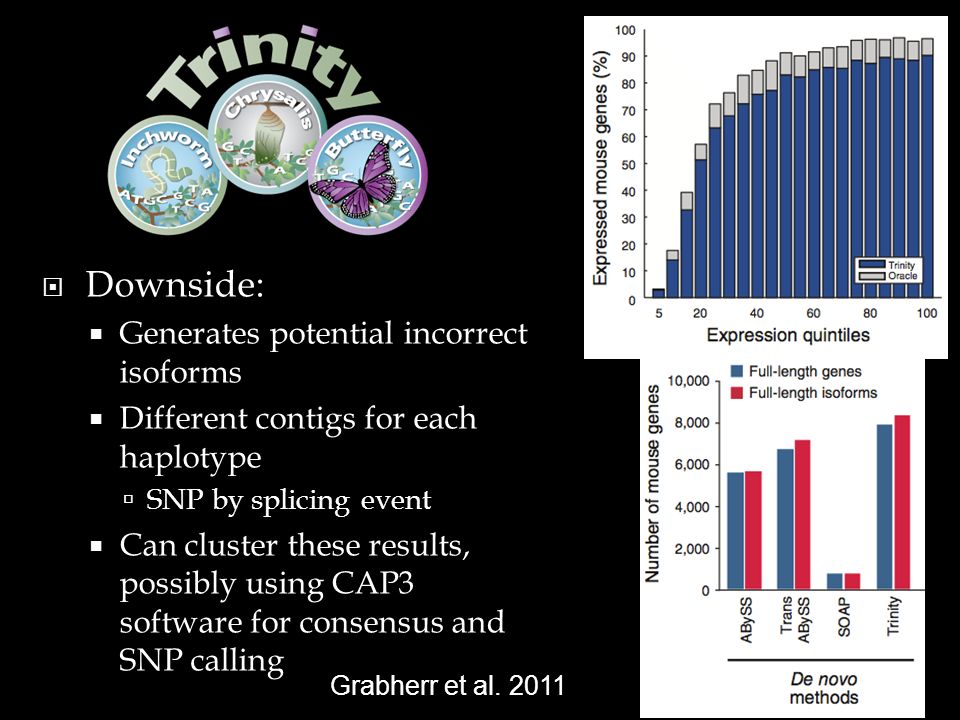
Downside: Generates potential incorrect isoforms Different contigs for each haplotype SNP by splicing event Can cluster these results, possibly using CAP3 software for consensus and SNP calling 31 Grabherr et al. 2011
32
Calling SNPs Many programs do this now Each sequencing method has specific errors associated Best to use SNP calls > 2 reads for minor allele to ensure validity Generate consensus sequences with SNP calls as template for probe design Know the sensitive region of probes to SNP/indel variation … Agilent probes are robust! 32

33
SNP calling33 Wheat, C. W. (2012) SNP Discovery in Non-model Organisms Using 454 Next Generation Sequencing. Many different methods, criteria. Just cause its published doesn’t make it ideal for you
 SNP Discovery in Non-model Organisms Using 454 Next Generation Sequencing. Many different methods, criteria. Just cause its published doesn’t make it ideal for you.")
34
Choosing Probes Binding performance SNPs, indels, alternative splicing Avoid them? Use them, via tiling probes? All genes or just annotated ones? 3’ UTR end or tiling across whole gene Recommend Technical replicates within array Run a test array to assess design Combination of the above? 34

35
35

36
Potential example Only genes / contigs with annotations Probes in triplicate Tiled across entire gene Covering SNPs, indels, atl. Splicing sites Initial array designed, printed, and tested with several different RNA pools to look at probe hybridization performance Full experimental set of arrays ordered + 20% 36

37
Challenge: Bioinformatics Annotation of fragmented data Multiple contigs may belong to same gene Unannotated sequences (novel coding, UTR, junk?) How conduct statistical analysis of the fragmented data? Combine results, pick best probes, etc.? Are outliers biological or technical If biological, separate loci or splicing? Unannotated probes with significant results Where to go?

38
What will change tomorrow Read lengths and quality Read lengths per DNA strand Paired end fragment sizes Parallelization Number of samples per run Amount of starting material needed Bioinformatic tools RNA-Seq more common ……

39
What won’t change tomorrow Need for good experimental questions & design Biological realities Complications of finding the genes Expression Patterns of genetic variation Need for validation (indep. & higher) Limited annotation insights
 Limited annotation insights.")
40
Conclusion Many methods and rationals for using some over others You needed to decide what you want Arrays work great, but will they take you where you want to go? Analysis is the most challenging part, so work with datasets that will be similar to yours. Can you get answers from those that you want? What software/program skills do you need? Collaboration helps for many things

41
Some references Feldmeyer, B., C. W. Wheat, N. Krezdorn, B. Rotter and M. Pfenninger (2011) Short read Illumina data for the de novo assembly of a non-model snail species transcriptome (Radix balthica, Basommatophora, Pulmonata), and a comparison of assembler performance. BMC Genomics, 12:317. Wheat, C. W., and H. Vogel (2011) Transcriptome sequencing goals, assembly and assessment in V. Orgogozo, and M. V. Rockman, eds. Molecular methods for evolutionary genetics. Humana Press, New York. Wheat, C. W. 2008 Rapidly developing functional genomics in ecological model systems via 454 transcriptome sequencing. Genetica 138: 433 - 451. PDF. Hornett, E. A. and C. W. Wheat (2012) Quantitative RNA-Seq analysis in non- model species: assessing transcriptome assemblies as a scaffold and the utility of evolutionary divergent genomic reference species. BMC Genomics. 13:361. Grabherr, M. G. et al. (2011) Full-length transcriptome assembly from RNA-Seq data without a reference genome. Nat Biotechnol. 29, 644–652 Kumar, S. and Blaxter, M. L. (2010) Comparing de novo assemblers for 454 transcriptome data. BMC Genomics. 11, 571 41 Many available on my website: www.christopherwheat.net
 Short read Illumina data for the de novo assembly of a non-model snail species transcriptome (Radix balthica, Basommatophora, Pulmonata), and a comparison of assembler performance. BMC Genomics, 12:317. Wheat, C. W., and H. Vogel (2011) Transcriptome sequencing goals, assembly and assessment in V. Orgogozo, and M. V. Rockman, eds. Molecular methods for evolutionary genetics. Humana Press, New York. Wheat, C. W Rapidly developing functional genomics in ecological model systems via 454 transcriptome sequencing. Genetica 138: PDF. Hornett, E. A. and C. W. Wheat (2012) Quantitative RNA-Seq analysis in non- model species: assessing transcriptome assemblies as a scaffold and the utility of evolutionary divergent genomic reference species. BMC Genomics. 13:361. Grabherr, M. G. et al. (2011) Full-length transcriptome assembly from RNA-Seq data without a reference genome. Nat Biotechnol. 29, 644–652 Kumar, S. and Blaxter, M. L. (2010) Comparing de novo assemblers for 454 transcriptome data. BMC Genomics. 11, Many available on my website:")
42
Some recommendations Illumina sequencing, paired end, variable fragment size from 200-500, unnormalized (but normalized is better). Many individuals X tissues X treatment, etc., to reflect the experimental material Assemble with Trinity, join isoforms and haplotypes into contigs using CAP3 Assess via BLAST to relevant species Annotate dataset Design probes for annotated genes, tiling when possible for SNPs, indels, and splicing Consider running test set of probes to assess. 42

43
Thanks

Similar presentations


>")


