Download presentation
Presentation is loading. Please wait.

1
LEAN Basics for Offices January 13, 2015

2
WHAT IS “LEAN”? Maximize customer value while minimizing waste.

3
Value Add –Customer believes it is important; willing to pay for this task –Physically changes the thing adding desired function, form, or feature –Work is done right the first time Non-Value Add –Task adds no value as viewed by the customer –Examples include: correcting/reworking, expediting, multiple signatures, counting, handling, inspecting, set up time, downtime, transporting, moving, delaying, storing…etc. Necessary Non Value Add –Process would break down if this task was not performed –Required by law or regulation –Task reduces financial risk What Is Value?

4
What Is Waste? Waste is “anything other than the minimum amount of equipment, materials, parts, space, and worker’s time which are absolutely necessary to add value to the product.” - Shoichiro Toyoda, President, Toyota

5
Value: what customers are willing to pay for Value Stream: all the steps in our processes that deliver value to our customers Flow: organizing the Value Stream to be continuous Pull: responding to downstream customer demand Perfection: relentless continuous improvement culture; A continuous journey Value: what customers are willing to pay for Value Stream: all the steps in our processes that deliver value to our customers Flow: organizing the Value Stream to be continuous Pull: responding to downstream customer demand Perfection: relentless continuous improvement culture; A continuous journey

6
Lean WASTES EXAMPLES of DOWNTIME DefectsData errors, missing info, errors in documents, confusing instructions or requirements, typos OverproductionUnneeded reports and copies, excess e-mail messages, doing work not requested Waiting Time for approval cycles, waiting for information or decisions, waiting for people in meetings Not Utilizing People’s knowledge, skills, and abilities – mental, creative, physical TransportationTransporting forms and information around the office unnecessarily or inefficiently InventoryBacklog of work (permits, plan approvals), excess materials/info, obsolete databases/files/folders MotionTrips to printer and copier, unnecessary movement to find files or supplies, travel to meetings Excess Processing Lack of communication, redundant inspection, re-entering of data, unnecessary process steps
, excess materials/info, obsolete databases/files/folders MotionTrips to printer and copier, unnecessary movement to find files or supplies, travel to meetings Excess Processing Lack of communication, redundant inspection, re-entering of data, unnecessary process steps")
7
7 GREEN Wastes Energy Water Materials Garbage Transportation Emissions Biodiversity www.greenenterprise.ca

8
Lean Tools 2-Bin System 5 Why’s 5S A3 Report ABC Inventory Benchmarking Bottleneck Analysis Cause and Effect (Fishbone) Diagram Cellular Manufacturing Check Sheet Cross-training Current State Map Dynamic Scheduling Empowerment ERP External Setups Failure Modes and Effects Analysis (FMEA) Flexible Manufacturing System Flow Chart. Future State Map Heijunka ISO standards JIT/Inventory Reduction Jikoda Kaizen Events Kanban/Small Batch Sizes Lean Supermarket Level Loading Mass Customization Metrics Based Process Mapping Milk Run Mind Maps One Piece Flow One-Touch Exchange of Dies Pareto Charts Poke-a-Yoke/Error-proofing S&OP Six Sigma SMART Goals Single Minute Exchange of Dies (SMED) Spaghetti Diagram Standardized Work Statistical Process Control Takt Time Time Study Total Productive Maintenance Value Stream Mapping Visual Cues/Painted Floor Visual Metrics Visual Status Indicators Waste Walk Zero Quality Control
 Spaghetti Diagram Standardized Work Statistical Process Control Takt Time Time Study Total Productive Maintenance Value Stream Mapping Visual Cues/Painted Floor Visual Metrics Visual Status Indicators Waste Walk Zero Quality Control.")
9
Lean Office Tools 2-Bin System 5 Why’s 5S A3 Report ABC Inventory Benchmarking Bottleneck Analysis Cause and Effect (Fishbone) Diagram Cellular Manufacturing Check Sheet Cross-training Current State Map Dynamic Scheduling Empowerment ERP External Setups Failure Modes and Effects Analysis (FMEA) Flexible Manufacturing System Flow Chart. Future State Map Heijunka ISO standards JIT/Inventory Reduction Jikoda Kaizen Events Kanban/Small Batch Sizes Lean Supermarket Level Loading Mass Customization Metrics Based Process Mapping Milk Run Mind Maps One Piece Flow One-Touch Exchange of Dies Pareto Charts Poke-a-Yoke/Error-proofing S&OP Six Sigma SMART Goals Single Minute Exchange of Dies (SMED) Spaghetti Diagram Standardized Work Statistical Process Control Takt Time Time Study Total Productive Maintenance Value Stream Mapping Visual Cues/Painted Floor Visual Metrics Visual Status Indicators Waste Walk Zero Quality Control
 Spaghetti Diagram Standardized Work Statistical Process Control Takt Time Time Study Total Productive Maintenance Value Stream Mapping Visual Cues/Painted Floor Visual Metrics Visual Status Indicators Waste Walk Zero Quality Control.")
10
5S – Haw River State Park Storage Area in Maintenance Shed

11
Spaghetti Diagrams

12
Value Stream Mapping

13
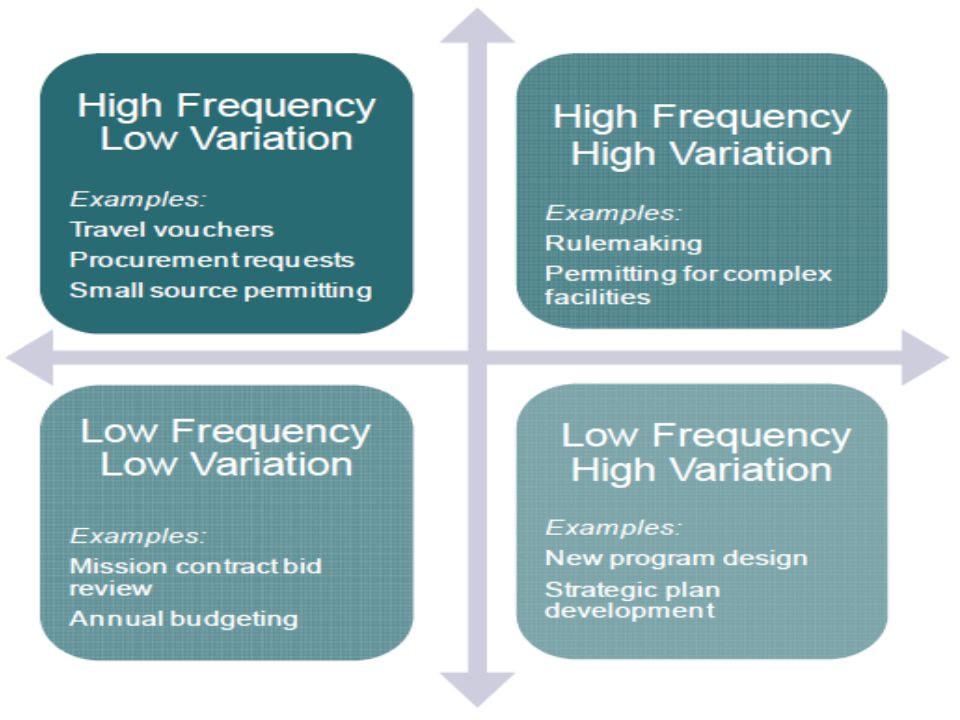
Selecting a Lean Project Start with a simple process… 1.With management support… 2.Important enough… 3.Or painful enough… 4.To get attention! Other Criteria…

15
Questions? Angela Barger angela.barger@ncdenr.gov 919-707-8126

Similar presentations


 Waiting: 3.Non-Utilized Talents: Under.>")


: an older name for lean systems Toyota Production System (TPS): another name for lean systems, specifically as.>")

 Set-up and changeover reductions for equipment,>")


